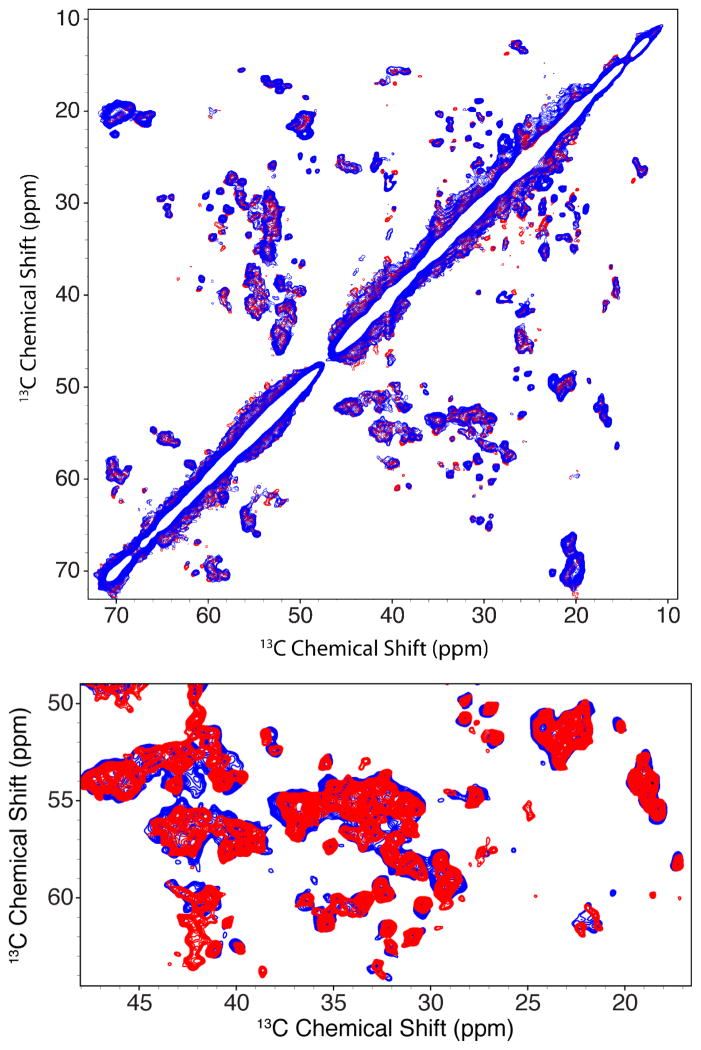
Figure 5.
Comparison of 13C-13C RFDR correlation experiments performed on VDAC1 DMPC 2D crystals at 4°C (blue) and above the phase transition temperature (>30°C, red). Comparison of chemical shifts show the structure of VDAC1 is not perturbed by changes in the DMPC phase. The spectra were recorded with a 1.3 ms RFDR mixing period, at ωr/2π= 12.5 kHz, ω0I/2π=750 MHz and with 83 kHz TPPM decoupling during evolution and acquisition. Spectra were plotted and processed in nmrPipe with the same parameters and plotted on the same scale in Sparky. In the top spectrum, the low temperature spectrum was overlaid on top of the high temperature spectrum. For the bottom spectrum, the high temperature data was overlaid on top of the low temperature data and contour levels for both spectra were reduced to emphasize potential differences.

