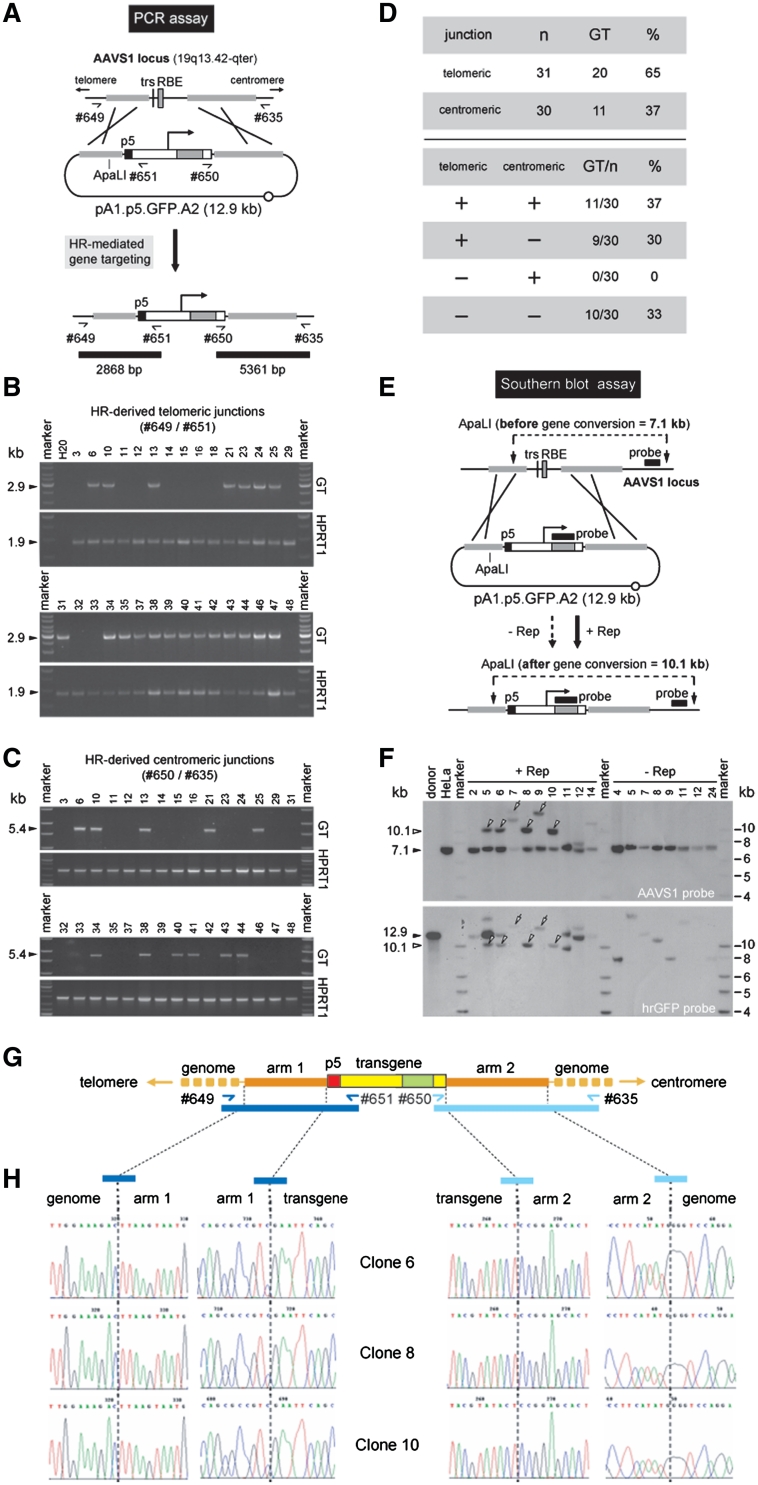
Figure 2.
Detection of homology-directed gene targeting events. (A) Diagram of the PCR assay deployed to identify cells genetically modified through HR-mediated GFP gene addition. The primer pairs #649/#651 and #650/#635 allow the detection of HR events at the AAVS1 of human cells transfected with the targeting construct pA1.p5.GFP.A2 by yielding diagnostic 2868-bp and 5361-bp PCR amplicons, respectively (horizontal black bars). Half arrows, primers #649, #651, #650 and #635 drawn in relation to their respective target sequences; thin black line, AAVS1 chromosomal region; horizontal thick grey lines, sequences shared by target and donor DNA; grey bar and vertical black line, RBE and trs, respectively; black box, nicking-prone p5 element; open box with broken arrow, EF1α promoter; large grey box, GFP ORF; open box, SV40 pA signal; open circle, prokaryotic origin of DNA replication. (B) PCR screening of clones derived from stably transfected HeLa cell populations initially co-transfected with pA1.p5.GFP.A2 and pGAPDH.Rep78/68. The panels labeled GT display the results of amplification reactions carried out with primers #649 and #651. PCR amplification of a 1.9-kb segment of the hypoxanthine phosphoribosyltransferase 1 gene (HPRT1) was performed in parallel to ascertain the integrity of the various genomic DNA templates (panels marked HPRT1). Marker, Gene Ruler DNA Ladder Mix (Fermentas); H20, PCR performed with nuclease-free water instead of chromosomal DNA. The positions (arrowheads) and sizes (in kb) of the PCR products are indicated at the left. (C) PCR screening of clones derived from stably transfected HeLa cell populations originally co-transfected with pA1.p5.GFP.A2 and pGAPDH.Rep78/68. The panels marked GT correspond to the PCR assay performed with primers #650 and #635 whereas those labeled HPRT1 are for the purpose specified in the legend of Figure 2B. (D) Summary of the data presented in Figure 2B and 2C, which resulted from the PCR assays depicted in Figure 2A. (E) Schematic representation of the Southern blot assay with ApaLI-digested genomic DNA from randomly selected clones of pA1.p5.GFP.A2-transfected HeLa cells. Unmodified target loci should yield a 7.1-kb AAVS1-specific restriction fragment while ‘two-sided’ HR should give rise to a DNA species of 10.1 kb hybridizing to the AAVS1- as well as the GFP-specific probe (black horizontal bars). Both probes are drawn in relation to their respective target DNA sequences. For an explanation of the other elements and symbols see the legend of Figure 2A. (F) Southern blots of ApaLI-treated genomic DNA of untransfected HeLa cells (HeLa) and of HeLa cell clones derived from cultures co-transfected with pA1.p5.GFP.A2 and pGAPDH.Rep78/68 (+Rep) or with pA1.p5.GFP.A2 and ‘empty’ plasmid (−Rep). The 12.9-kb ApaLI-linearized pA1.p5.GFP.A2 DNA (donor) served as an internal reference. Marker, Gene Ruler DNA Ladder Mix (Fermentas). (G) Diagram of the GFP expression unit (yellow and green boxes) inserted at 19q13.42-qter (horizontal yellow lines) upon homology-directed gene targeting deploying pA1.p5.GFP.A2 as donor template. Primers used to amplify the left- and right-hand junctions (dark and light blue half arrows, respectively) are drawn in relation to their recognition sequences. The 2.9- and 5.4-kb PCR amplicons specific for ‘telomeric’ and ‘centromeric’ DNA junctions are indicated by dark and light blue bars, respectively. (H) Nucleotide sequence analysis of ‘telomeric’ and ‘centromeric’ junctions between endogenous and exogenous DNA resulting from Rep78/68-induced HR events. The nucleotide sequences of the transition regions between pA1.p5.GFP.A2 sequences and flanking genomic or transgene DNA for three different clones that underwent HR are shown.

