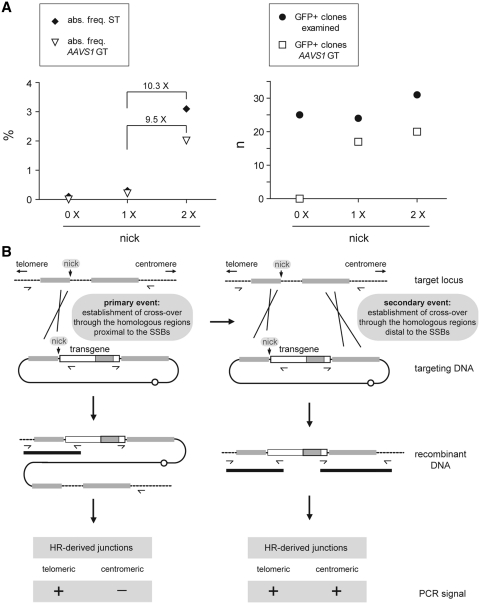
Figure 5.
(A) Summary of the data resulting from the HR-specific PCR assay presented in a previous study (16; values plotted in the leftward and middle columns [i.e. 0× nick and 1×nick, respectively]) and in the current work (values plotted in the rightward columns [i.e. 2× nick]). The results are shown in terms of the absolute frequencies of stably transfected (ST) cells (left graph, solid diamonds) and of AAVS1-targeted cells (left graph, open triangles) as well as in terms of the total numbers of reporter-positive clones analyzed (right graph, solid circles) and of those that were targeted at AAVS1 through HR (right graph, open squares). (B) Working model for nick-initiated mitotic HR in human cells (see text for details).

