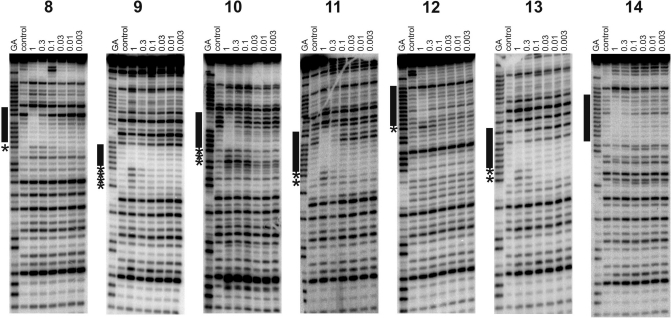
Figure 3.
DNase I footprints showing the interaction of B-TFO with REPSA-selected sequences 8–14. The experiments were performed in 50 mM sodium acetate pH 5.0; TFO concentrations (µM) are shown at the top of each gel lane. The DNA was labelled at the 3′-end; the gel therefore runs 5′–3′ from top to bottom. The lanes labelled ‘control’ show digestion of the DNA in the absence of oligonucleotide; tracks labelled ‘GA’ are markers specific for purines. The locations of the footprints are indicated by the filled boxes and any accompanying enhancements are indicated by asterisks.

