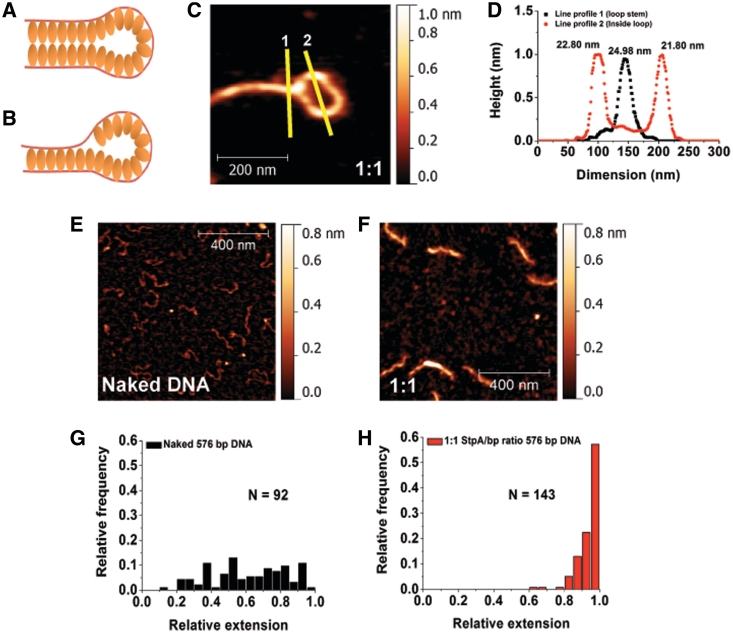
Figure 2.
DNA–StpA co-filament interacts with naked DNA to form DNA bridges. (A and B) Hypothetical models of StpA-induced DNA bridging. (C) Zoomed-in StpA-coated DNA loop image. The lines are drawn to generate the width profiles in panel D. (D) AFM line profile analysis shows no significant difference between the half-height–widths of StpA-coated DNA in the loop and at the loop stem. Width values are indicated at the top of the respective peaks. (E) 1 × 1 µm image of linear 576-bp DNA with z-scale of 0–0.8 nm. (F) A 576-bp DNA substrates incubated at 1:1 StpA:DNA ratio. Comparing with E, StpA-coated 567-bp DNA is thicker and more straight, demonstrating monomeric rigid DNA–StpA co-filaments. The latter model (Figure 2B) is thus preferred over the former (Figure 2A). (G) Histogram of naked 576-bp DNA relative extension (or DNA end-to-end extension over its contour length). The distribution is widely spread, suggesting significant thermal fluctuation of DNA conformations. (H) Relative extension histogram of 576-bp DNA substrates incubated in 1:1 StpA:DNA ratio. The distribution shows that all the DNA are extended to nearly its full-contour length, suggesting significant DNA stiffening that suppresses the DNA conformational fluctuations. This is in agreement with the model in Figure 2B. Experiments were performed in 10 mM Tris, 50 mM KCl, pH 7.4 buffer.

