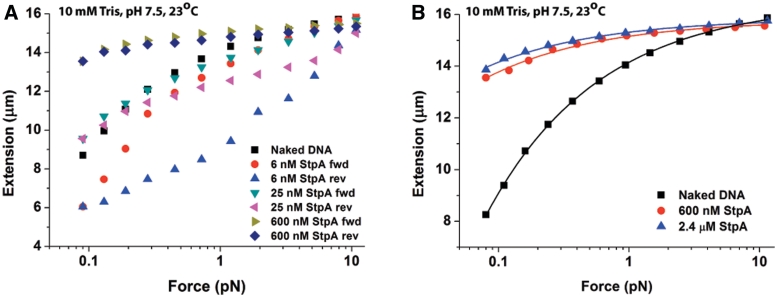
Figure 3.
Single-DNA stretching experiments show kinetic competition between StpA rigid protein filaments formation on DNA and DNA–StpA co-filament-dependent DNA bridging. (A) Forward and reverse force-extension curves (see panel figure legends) of 48 502 bp λ-DNA in 50 mM KCl 10 mM Tris pH 7.4 at the indicated StpA concentrations (up to saturation). At 6 nM StpA, strong hysteresis was observed, implying dominance of the StpA–DNA bridging mode. At 600 nM StpA, DNA stiffening due to protein filament formation dominated, with an increase in DNA extension and lack of hysteresis. At 25 nM StpA, a mixture of both modes is observed. (B) Force-extension curves of λ-DNA in 50 mM KCl, 10 mM Tris pH 7.4 indicate saturated binding at 600 nM StpA. This results in DNA stiffening due to protein filament formation. Only the forward curves are shown due to the absence of hysteresis. The solid lines represents fitting by the DNA worm-like-chain (WLC) model (see Supplementary Methods: Transverse Magnetic Tweezers Experimental Setup) fitting to experimental data points. The WLC model fit gives a persistence length with fitting error of 639.67 ± 34.80 nm and 909.50 ± 48.56 nm for 600 nM and 2400 nM StpA concentration, respectively. In addition, the fitted contour length with fitting error is 15 794.54 ± 32.27 nm and 15 851.05 ± 27.05 nm for 600 nM and 2400 nM StpA concentration, respectively.

