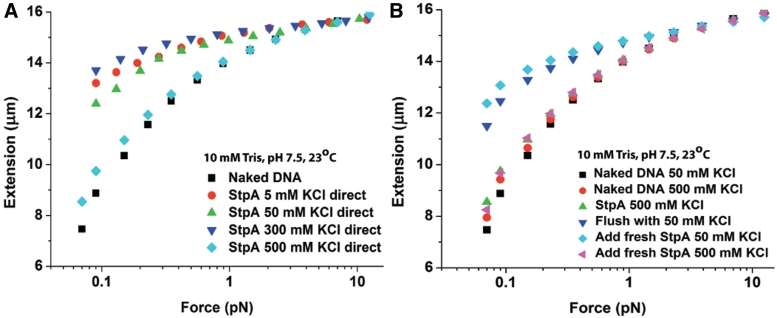
Figure 4.
The StpA protein filament was disrupted at high salt. Only the forward curves are plotted as hysteresis was not observed. (A) Force-extension curves at 600 nM StpA incubated in the KCl concentrations indicated in figure legend. As in Supplementary Figure S3, there was little change in stiffening between 5 and 300 mM KCl. However, at 500 mM KCl, almost no stiffening (filament formation) occurs. (B) Force-extension curves at 600 nM StpA during a series of buffer cycling. After StpA binds to DNA at 500 mM KCl, the remaining free protein was removed from the solution. A near saturated stiffened DNA was then obtained by changing the buffer to 50 mM KCl, implying that at 500 mM KCl StpA binding remains near saturation despite the lack of stiffening. Finally, after achieving saturation stiffening with StpA in 50 mM KCl, the stiffening was nearly eliminated by adding fresh StpA in 500 mM KCl.

