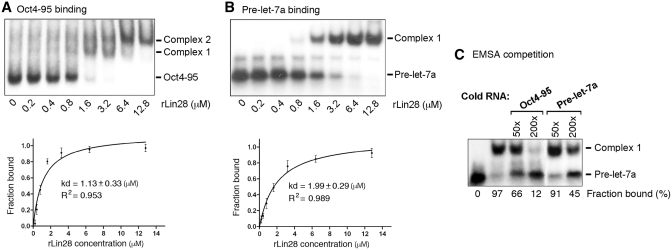
Figure 1.
Lin28 binds Oct4-95 in vitro. Autoradiographs of EMSA using labeled Oct4-95 (A) or pre-let-7a RNA (B) with increasing amounts of rLin28. The positions of unbound RNA– and RNA–protein complexes are marked to the right. Band intensities were quantified from three independent experiments and used to calculate the Kd values shown in the plots below. In the case of Oct4-95, Complex 1 and 2 were combined as one complex in Kd calculation. (C) Autoradiograph of EMSA performed with labeled pre-let-7a RNA and 3.2 µM of rLin28. The amounts of unlabeled competitor Oct4-95 or pre-let-7a RNA added in relative molar excess are indicated on the top. Band intensities were calculated and presented as percentage of fraction bound. Numbers are averages of two independent experiments.

