Figure 1.
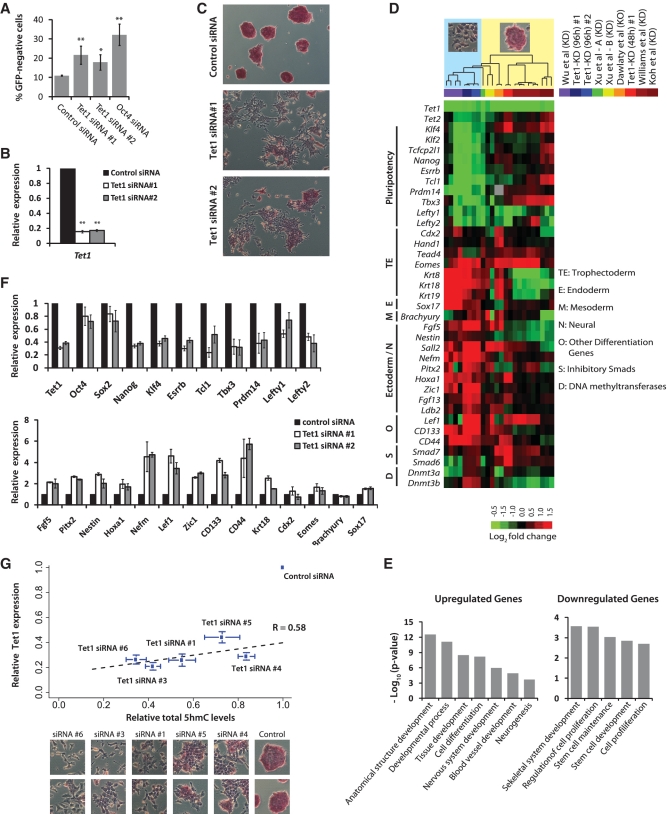
Depletion of Tet1 and 5hmC levels results in loss of mouse embryonic stem identity. (A) Oct4GiP mESCs were transfected with indicated siRNAs in normal ESC medium and cultured for 96 h. The percentage of differentiated cells was determined by measuring the percentage of GFP-negative cells using FACS at 96 h after transfection (**P < 0.001; *P < 0.01). Error bars represent SEM of three experiments. (B) Relative Tet1 mRNA level in control and Tet1 KD Oct4GiP mESCs 48 h after transfection. Data are normalized to Actin. Error bars represent SEM of three experiments (**P < 0.001). Error bars represent SEM of three experiments. (C) AP staining of Oct4GiP mESCs transfected with control siRNA, and Tet1 siRNAs #1 and #2. Cells were cultured in normal ESC medium, and AP staining was performed 96 h after transfection. See Supplementary Figure S1B for AP staining results for siRNA #1 and four additional siRNAs on Oct4GiP, J1 and E14tg2a mESCs. (D) Expression fold changes of selected genes upon Tet1 KD in mESCs based on microarray analysis performed 48 and 96 h after transfection. Fold changes from data generated for this study [Tet1-KD (96 h) #1, #2 and Tet1-KD (48 h) #1] are presented alongside fold changes observed in recently published Tet1 KD (≥96 h) or knockout studies (color-coded on the top-right). Each column corresponds to fold changes obtained from an individual array computed in relation to its corresponding control array. Observed/reported morphological changes are symbolically indicated at the top, with columns ordered based on unsupervised hierarchical clustering. See Supplementary Figure S1C for a comprehensive heatmap. (E) Gene ontology analyses of up- and down-regulated genes in Tet1 KD cells compared to control cells. Only selected categories are shown. For complete lists, see Supplementary Table S6. (F) Relative mRNA levels of selected mESC pluripotency-associated genes and lineage marker genes in control and Tet1 KD mESCs at 96 h after transfection. The mRNA levels in control cells are set as one. Data are normalized to Actin. Error bars represent SEM of three experiments. (G) Scatter plot showing strong positive correlation among relative Tet1 mRNA levels, relative total 5hmC levels, morphogical changes, and AP staining in control and Tet1 KD E14Tg2a mESCs. Each data point corresponds to a siRNA that was used for transfection. The y-axis indicates relative Tet1 mRNA levels 96 h after KD, and the x-axis represents quantified intensity of 5hmC signal inferred from slot blot (96 h). Bottom panel show the corresponding representative morphological changes and AP staining for each siRNA. Error bars represent SEM of data from five replicates (different amounts of DNA were spotted) from two independent experiments.

