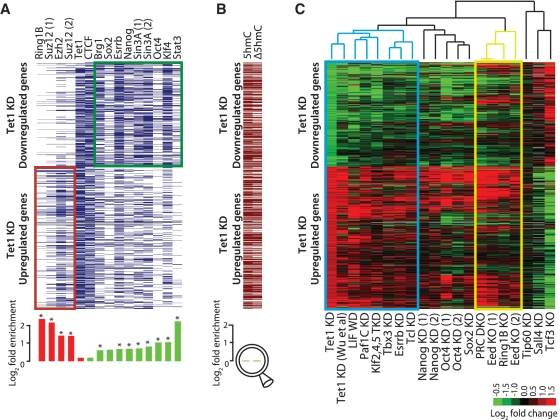
Figure 2.
Meta-analysis of genomic data sets suggests interaction between Tet1 and LIF/Stat3 signaling. (A) Top: Transcription factor occupancy at 919 genes differentially expressed upon Tet1 KD (389 downregulated and 530 upregulated). Genes are represented along the y-axis and factor occupancy is denoted by blue bar. Target gene occupancy is defined as factor occupancy within 5-Kb upstream of the gene's TSS and/or within its gene body. Bottom: Log-fold enrichment of factor occupancy at up/downregulated genes. Red and green histograms denote enrichment in up- and down-regulated genes, respectively. *P < 0.01 after Bonferroni adjustment for multiple testing. (B) Top: Presence/absence of 5hmC sites (5hmC) in control mESCs, and 5hmC sites with ≥1.5-fold reduced hydroxymethylation levels (Δ5hmC) in Tet1 KD mESCs (96 h). Bottom: Log-fold enrichment at down- versus up-regulated genes, respectively. (C) Expression fold changes of 919 genes differentially expressed upon Tet1 KD (96 h; first column) presented alongside fold changes observed after KD or knockout (KO) of select other pluripotency factors in published reports. Genes are represented along the y-axis. Data sets along the x-axis have been ordered based on unsupervised hierarchical clustering of corresponding gene expression fold changes. Blue and yellow rectangles highlight Tet1-LIF and Polycomb clusters, respectively. Cells with no/missing data are colored in gray (DKO: double KO).

