Figure 5.
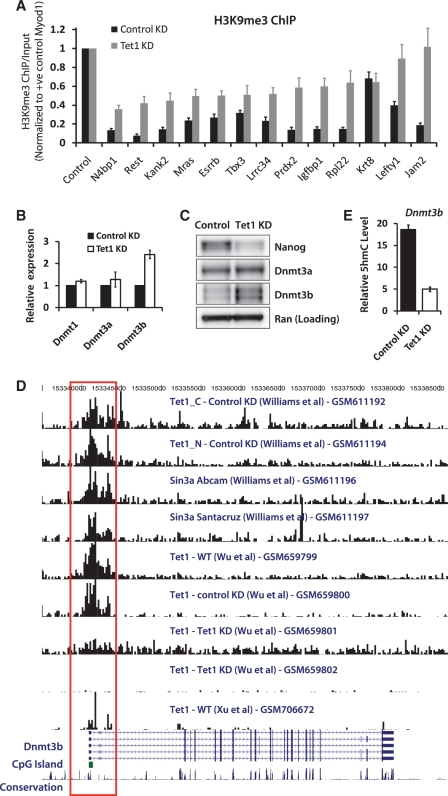
Tet1 negatively regulates de novo DNA methyltransferase Dnmt3b. (A) ChIP assay of select Stat3 target regions using an antibody against H3K9me3 in control and Tet1 KD mESCs (48 h). The y-axis represents enrichment over input normalized to a positive control region (Myod1) for H3K9me3. Error bars represent SEM of three experiments. (B) Relative mRNA levels of DNA methyltransferases Dnmt1, Dnmt3a and Dnmt3b in control and Tet1 KD mESCs 96 h after transfection. The mRNA levels in control cells are set as 1. Data are normalized to Actin. Error bars represent SEM of three experiments. (C) Western blot analysis showing protein levels of Nanog, Dnmt3a and Dnmt3b in control and Tet1 KD mESCs 96 h after transfection. Ran is used as a loading control. (D) Genome browser shot showing a region containing the Dnmt3b gene and results from Tet1 and Sin3a ChIP-Seq experiments by various groups (GSM numbers denote GEO accession). The red open rectangle highlights Tet1 occupancy at the promoter region of Dnmt3b, where a CpG island is present (green-filled rectangle). (E) Relative 5hmC levels at Dnmt3b locus in control and Tet1 KD (96 h) mESCs. Error bars represent SEM of three experiments.

