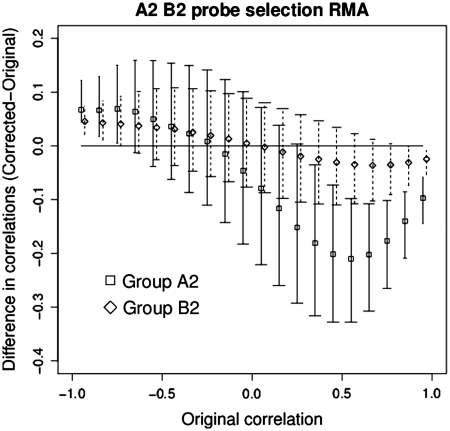
Figure 4.
Plot comparing the change in correlation, before and after removal of two probes, of the probe sets in groups A2 and group B2. The central points indicate the median. The bars indicate the upper and lower quartiles. The width of the end bars reflect the number of data points (widest for the most numerous, shortest for the least).

