Figure 1.
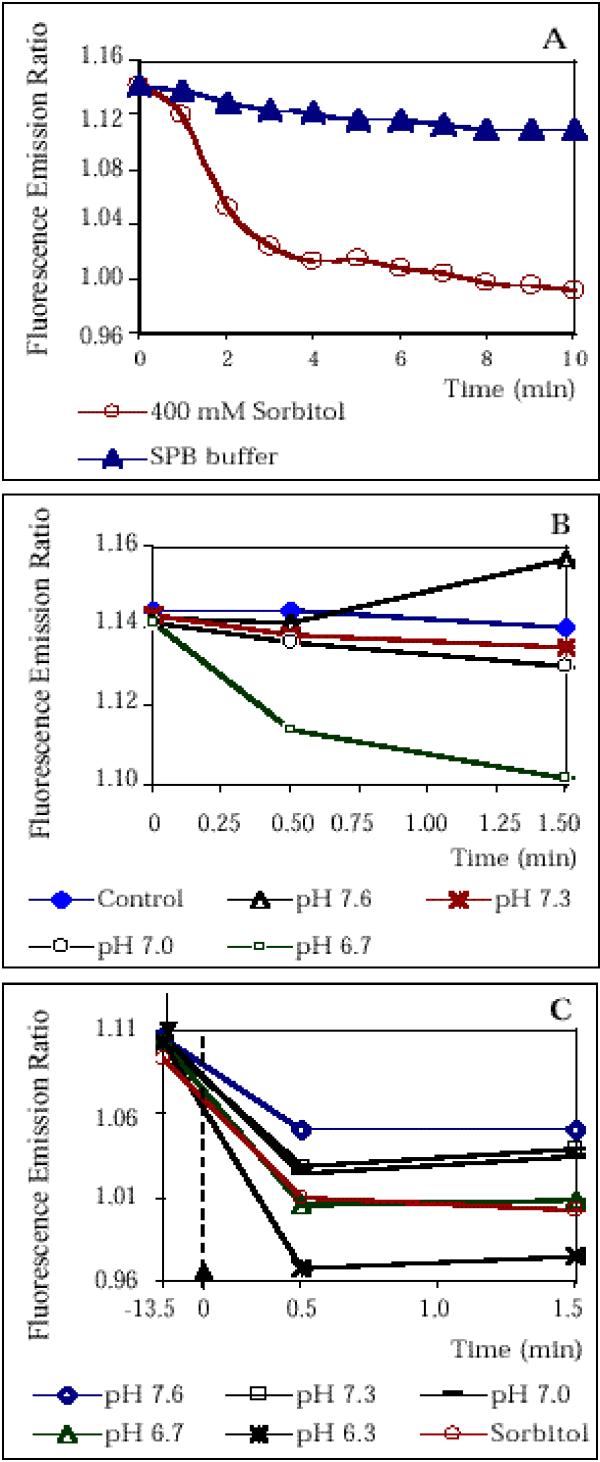
FACS measurements using BCECF as fluorescent pH indicator show that hyperosmotic stress results in intracellular acidification (A) AX-2 cells were labeled with BCECF and were subsequently exposed to hyperosmotic stress. Fluorescence emission was determined at FL1 and FL2 by flow cytometry and the fluorescence emission ratio FL1/FL2 was calculated. The decrease in FL1/FL2 of cells exposed to hyperosmotic shock ("400 mM Sorbitol") reflects a decrease in pH. As control, the measurements were performed with cells suspended in SPB buffer. (B) Calibration of intracellular pH of cells in low osmolarity buffer. BCECF-labeled cells were suspended in calibration solutions with different Pseudo-Null pH values [25] and FL1/FL2 was determined by flow cytometry at intervals. The solution with Pseudo-Null pH 7.3 slightly decreased FL1/FL2 compared to the control cells suspended in SPB buffer and the solution with Pseudo-Null pH 7.6 increases FL1/FL2 compared to the control. Hence, the actual intracellular pH is estimated to be pH 7.3 to pH 7.4. (C) Calibration of the pH of hyperosmotically shocked cells. After BCECF labeling, Dictyostelium cells were suspended SPB buffer and FL1/FL2 was determined at T=-13.5 min. Sorbitol solution was added (indicated by the upper arrow) and the cells were incubated for 10 min. The cells were centrifuged and resuspended in high osmolarity calibration solutions with different Pseudo-Null pH values at T = 0 min (indicated by the lower arrow). FL1/FL2 was determined by flow cytometry at intervals. The solution with Pseudo-Null pH 6.7 slightly decreased FL1/FL2 compared to the control ("Sorbitol"; cells suspended in SPB buffer/400 mM sorbitol) at T = 0.5 min, before intracellular pH starts to recover. This suggests, that the actual intracellular pH is 6.7-6.8. The points of time specified in Fig. 1C are not drawn to scale.

