Figure 2.
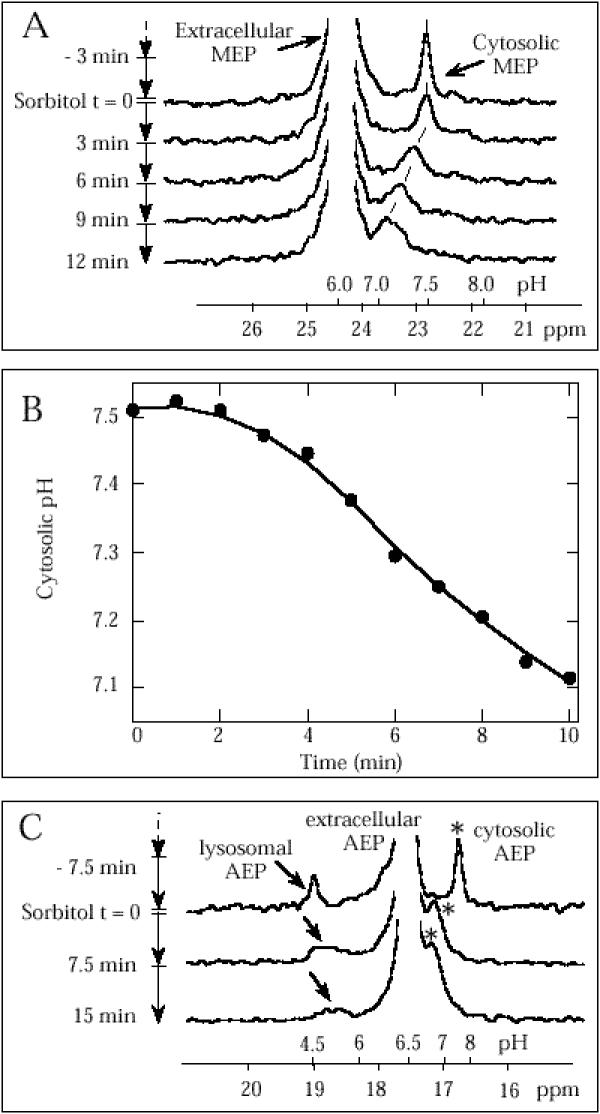
In vivo31 P-NMR analysis of the effect of hyperosmotic shock on cytosolic pH in Dictyostelium cells (A) The sequence of 31P-NMR spectra represents a typical experiment conducted with the probe MEP. After addition of MEP and preincubation during 60 min, a control spectrum was recorded for 3 min immediately before sorbitol addition (upper trace). Sorbitol (0.3 M) was then added at T = 0 and data were collected during successive 3-min intervals up to 12 min. NMR spectra shown are the sum of 180 free induction decays with 1-s interpulse delays and correspond to a 3-min accumulation. Only the spectral region around +24 ppm corresponding to MEP probe is shown. The pH scale shown on abcissa was calculated from the in vivo calibration curve pH = 7.6 + log(24.5 - δ)/(δ - 20.6), 8 being the chemical shift of MEP resonance. (B) Temporal evolution of cytosolic pH after onset of hyperosmotic shock in Dictyostelium cells calculated from the position of cytosolic MEP resonance (see A). (C) In vivo31P-NMR analysis of the effect of hyperosmotic shock on lysosomal pH in Dictyostelium cells. The sequence of successive 31P-NMR spectra represents a typical experiment conducted with the probe AEP. After addition of AEP and preincubation for 60 min, a control spectrum was recorded for 7.5 min immediately before sorbitol addition (upper trace). Sorbitol (0.3 M) was then added at T = 0 min and data were collected during two consecutive 7.5-min intervals. Only the spectral region around +18 ppm corresponding to AEP probe is shown. The pH scale indicated on the graph was calculated from the in vivo AEP calibration curve pH = 6.3 + log(19.1 - δ)/(δ - 16.5), δ being the chemical shift of AEP resonance. Lysosomal and cytosolic AEP satellite peaks, lowfield and upfield of extracellular AEP, respectively, are indicated by arrow and star symbols, respectively.

