Fig. 2.
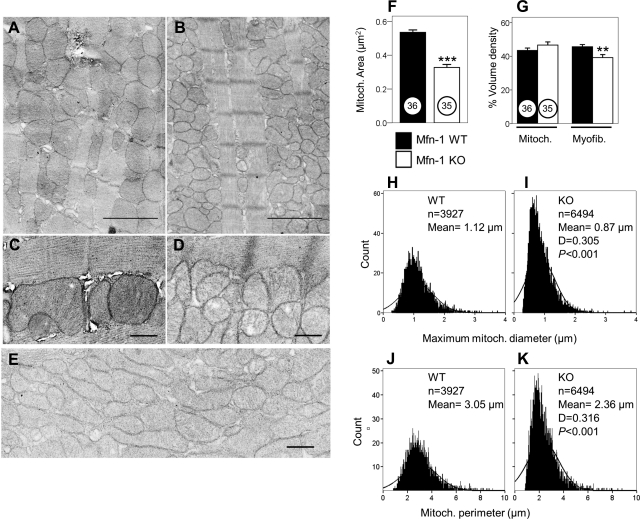
Electron microscopy images showing mitochondria and myofibrils from adult hearts. A: 5-mo-old Mfn-1 WT. B: littermate Mfn-1 KO, the scale bars in A and B = 2 μm. C: interfibrillar mitochondria in Mfn-1 WT heart. D: interfibrillar mitochondria in Mfn-1 KO heart, scale bars in C and D = 0.5 μm. E: distinct area of Mfn-1 KO heart (myofibrils present but not shown) containing unusually elongated/lamellar mitochondria; scale bar = 0.5 μm. F: area per individual mitochondrion measured from electron micrographs taken from 2 animals per genotype. Numbers in circles show the number of fields used per genotype (***P < 0.001). G: mitochondrial and myofibril volume density estimated by the grid method expressed as a percentage (grid contains 9 × 10 dots; **P < 0.01). H: histogram showing the distribution of maximum mitochondrial diameter of all the mitochondria identified (n = 3,927) in WT samples. I: histogram showing the distribution of maximum mitochondrial diameter of all the mitochondria identified (n = 6,494) in KO samples. D is value for most extreme differences determined by Kolmogorov-Smirnov analysis (P < 0.001) that the 2 histograms belong to the same distribution. J–K: same as in H and I for Mfn-1 WT and Mfn-1 KO, respectively, only that the histograms were created using mitochondrial perimeter.

