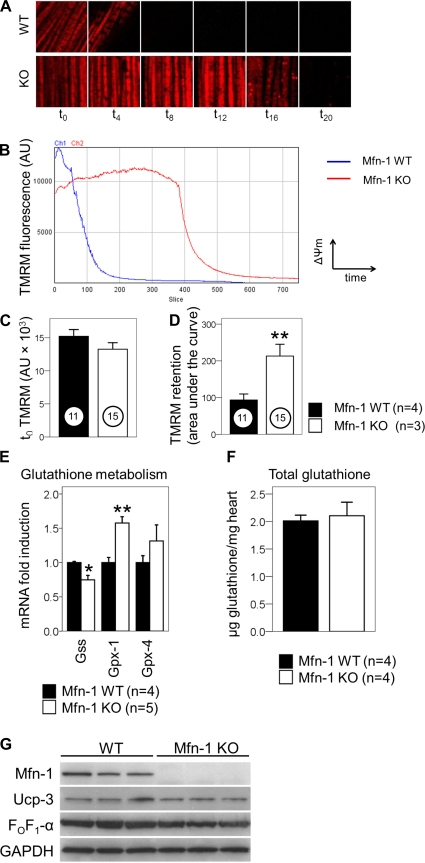
Fig. 3.
Mitochondrial depolarization downstream of H2O2 is delayed in single myocytes, but this does not involve altered H2O2 scavenging or electron transport chain uncoupling. A: representative images of myocyte areas (×25 μm) containing mitochondria undergoing depolarization with different kinetics (Mfn-1 WT above and Mfn-1 KO below). H2O2 was injected at t0 and imaging began immediately. Images shown were taken at the indicated time points (minutes) following H2O2 injection. B: graph showing dissipation of tetramethylrhodamine methylester (TMRM) fluorescence of a selected region of mitochondria after H2O2 exposure. On the y-axis, TMRM fluorescence [arbitrary units (AU)] is a quantitative indicator of inner membrane potential (ΔΨm) for the selected group of mitochondria. On the x-axis, time after H2O2 injection is shown as consecutive slices (time interval: 2.4 s). Channel 1 (blue) shows the course of depolarization in Mfn-1 WT myocytes, and channel 2 (red) shows the depolarization of Mfn-1 KO myocytes at the same conditions. C: TMRM fluorescence at t0 is quantified in myocytes from each group as a measure of basal membrane potential (ΔΨm; P = 0.189). D: capacity of mitochondria to lose TMRM is quantified as the area under the curve from traces such as those shown in B. Confocal microscopy experiment was done using 4 WT and 3 KO mice that were 2.5–5 mo old. Number of myocytes assessed are shown in circles for each group (6 myocytes were Mfn-1flox without cre, 5 were Mfn-1+ with cre, and 15 were homozygous Mfn-1flox with cre). E: relative levels of mRNAs encoding for proteins with the capacity to alter glutathione levels are quantified in whole-heart extracts. Gss, glutathione synthase; Gpx-1, glutathione peroxidase-1; Gpx-4, glutathione peroxidase-4, mitochondrial variant. F: levels of total glutathione (reduced and oxidized) in whole heart extracts are shown in μg/mg for the 2 experimental groups (2 mice were Mfn-1flox without cre, 2 mice were Mfn-1+ with cre, and 4 mice were homozygous Mfn-1flox with cre, aged 3.5–4 mo old). G: protein abundance of uncoupling protein-3 (UCP-3) and α-subunit of the FOF1-ATPase (FOF1-α) in Mfn-1 WT and KO hearts. *P < 0.05, **P < 0.01.

