Fig. 4.
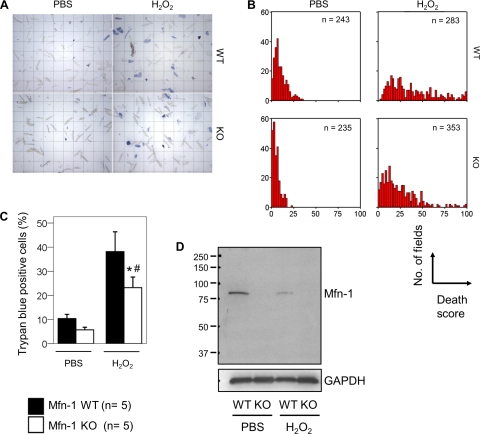
Viability assay of single adult cardiac myocytes. Experiment was done with 5 WT and 5 KO mice 2.5–5 mo old. A: microscopic fields containing single myocytes from WT and KO hearts previously treated in parallel with PBS or H2O2. Viable (unstained) vs. dead (blue) myocytes were counted, and each field was scored for the percentage of blue cells (death score). B: distribution analysis of all the fields scored (shown by n) according to their death score (0–100%). Clustering at the left of the x-axis indicates a low death index. C: average death score per treatment and genotype (n = 5 Mfn-1 WT or KO mice; *P < 0.05 WT vs. KO and #P < 0.05 PBS vs. H2O2). D: Western blot analysis performed to detect Mfn-1 protein levels in Mfn-1 WT and KO single myocytes following treatment with PBS and H2O2. GAPDH is used as a protein loading control. Numbers at left indicate respective molecular masses (37–250 kDa).

