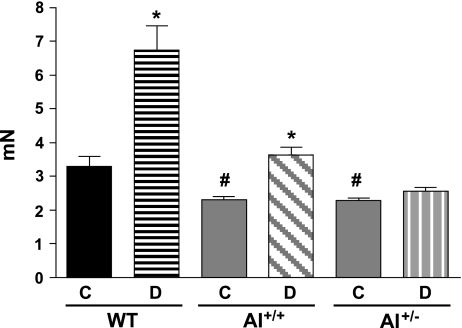
Fig. 3.
Effect of diabetes on the maximum contractile response to phenylephrine (10−6 M) in the aorta from WT, AI+/+, and AI+/− mice. The contractile response is given as developed tension (in nN). The solid bars indicate responses in control nondiabetic mice; the hatched bars indicate responses in diabetic mice. n = 4–6 mice/group. *P < 0.05 vs. control of that genotype; #P < 0.05 vs. control WT mice.

