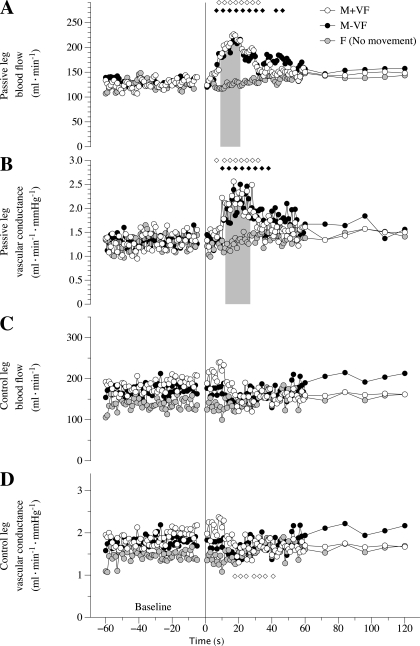
Fig. 4.
Peripheral hemodynamic responses to passive movement in the M+VF, M-VF, and F protocols. A: passive leg blood flow over time. B: passive leg vascular conductance over time. C: control leg blood flow over time. D: control leg vascular conductance over time. Note that the responses shown are the average responses of all subjects; therefore, the maximal peak values are underestimated. Diamonds indicate significant differences from the 60-s baseline average. The shaded bars in A and B indicate significantly lower values in the F protocol with respect to both the M+VF and M-VF protocols. Due to the multiple trials, variance in the data was omitted for clarity.

