Fig. 4.
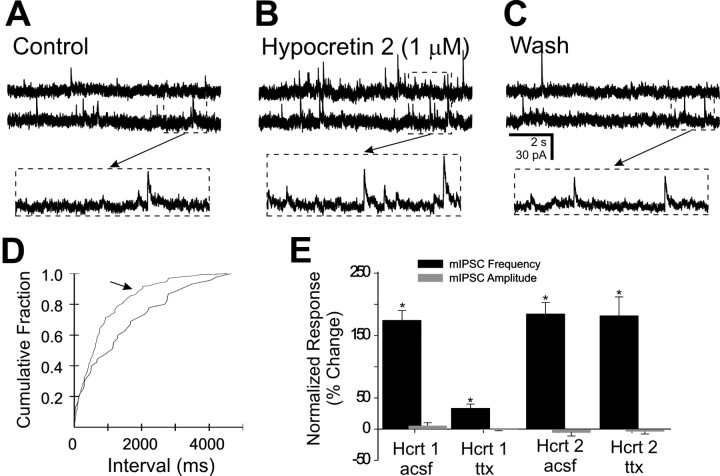
The effect of hypocretin on mIPSCs in the DMV in the presence of 2 μm TTX. A, Spontaneous mIPSCs were observed in this neuron at a holding potential of −5 mV.B, The same neuron in the presence of hypocretin 2 (1 μm). C, Twenty-five minute wash to ACSF with TTX. Arrows point to temporally expanded regions of the traces inA–C, as indicated. This cell was prelabeled by inoculation of the stomach wall with PRV-152.D, Cumulative fraction plot indicates a significant increase in mIPSC frequency by hypocretin 2 (arrow) (p < 0.05). E, Plots indicating frequency and amplitude changes observed after 1 μm hypocretin 1 and 2 application for several neurons. Asterisks indicate significant changes (p < 0.05) for frequency but not amplitude.

