
Figure 2.
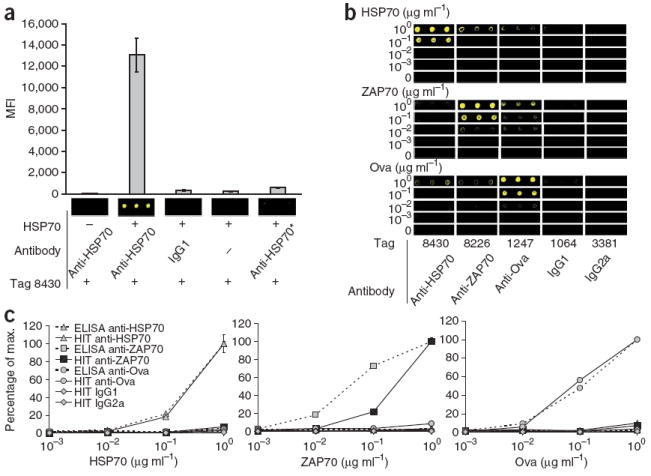
ELISA format HIT. (a) Scanned images and median fluorescent intensity (MFI) of a single-analyte reaction. We coated wells with buffer (−) or 1 μg ml−1 HSP70 (+). We then coupled an isotype control (IgG1) antibody or monoclonal antibody to HSP70 (anti-HSP70) to Fab-oligonucleotide tag 8430. *, anti-HSP70 was not preincubated with the Fab-oligonucleotide tag in this reaction. (b,c) Serial dilutions of HSP70, ZAP70 or ovalbumin (Ova) ranging from 1 μg ml−1 to 1 ng ml−1 probed by conventional single-analyte ELISA or with the multiplex HIT cocktail. Scanned images of 635-nm intensity (pseudocolored yellow; b) and percentage of maximum intensity of ELISA wells (c) and tags 8430, 8226, 1247, 1064 and 3381, which we used to label anti-HSP70, anti-ZAP70, anti-Ova and isotype controls IgG1 and IgG2a, respectively. For this experiment, we added biotin-UTP for incorporation during tag amplification, and then we probed the arrays with Alexa-647–streptavidin for visualization of hybridized tags. We calculated the percentage of maximum and s.d. (n = 3) from absorbance at 450 nm for the ELISA samples and from MFI for the HIT samples.