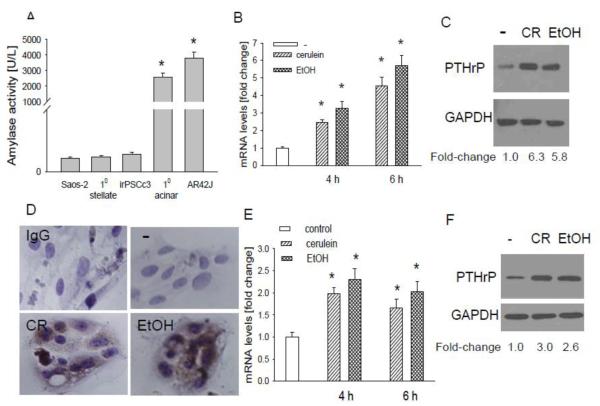
Figure 4. Effect of cerulein and ethanol on PTHrP levels in pancreatic acinar cells.
(A) Amylase secretion from mouse primary acinar cells and AR42J cells. Saos-2 (human osteosarcoma) cells and stellate cells were used as negative controls. (B-D) Effect of cerulein and ethanol on PTHrP levels in primary acinar cells. (B) Acinar cells were treated with cerulein (10−7 M) or ethanol (50 mM) for the indicated time intervals. PTHrP mRNA levels were measured by reverse transcription/real-time PCR. Values are expressed relative to the untreated value, set arbitrarily at 1.0. Each bar is the mean ± SEM of three independent experiments. * = Significantly different from the control value (P < 0.001). (C) Western blot analysis for PTHrP in acinar cells treated with cerulein (CR) or ethanol (EtOH) as described in (B) for 6 h. (D) Acinar cells treated as described in (B) for 6 h were fixed and analyzed by IHC. − = no treatment. IgG = antibody control. The panels other than IgG were immunostained with anti-PTHrP antibody. (E-F) Effect of cerulein and ethanol on PTHrP levels in AR42J cells. Cells were treated with cerulein or ethanol as in (B). (E) PTHrP mRNA levels were measured by reverse transcription/real-time PCR. Values are expressed relative to the untreated value, set arbitrarily at 1.0. Each bar is the mean ± SEM of three independent experiments. * = Significantly different from the untreated value (P < 0.001). (F) Western blot analysis for PTHrP in AR42J cells treated with CR or EtOH as described in (B) for 6 h. In (C) and (F), the relative PTHrP levels were obtained after densitometric scanning of the Western blots and normalization to GAPDH. The control value (−) was set at 1.0. The mean ± SEM values represent data obtained from three independent experiments.

