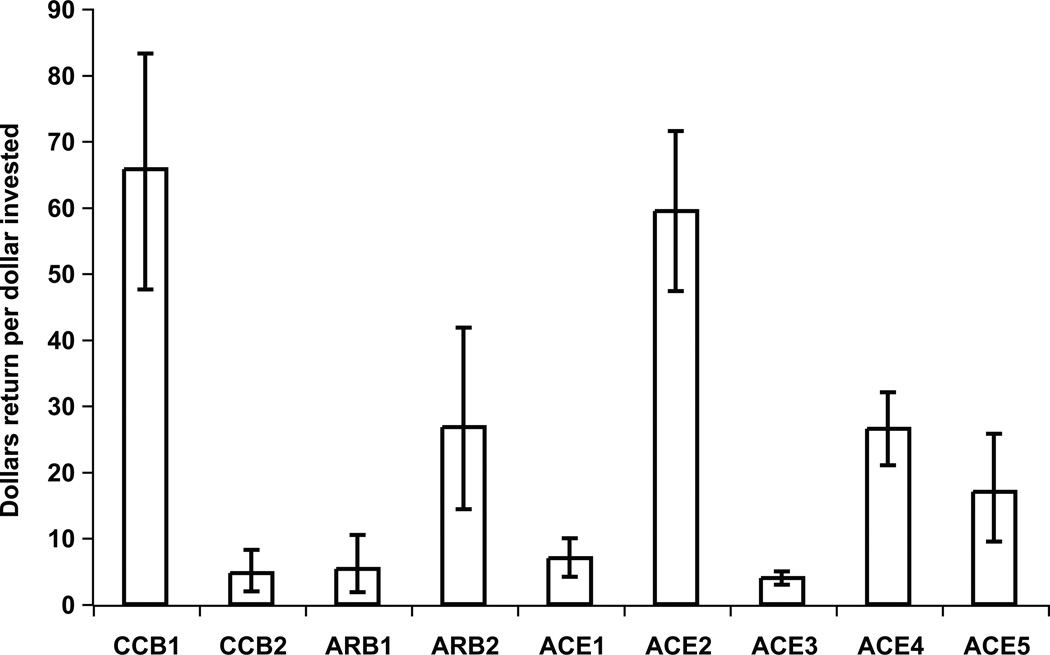
Figure 1. Dollars in net return for each dollar invested.
Economics of 6-month period of marketing exclusivity per study request: net return-to-investment ratio by anti-hypertensive agent. Error bars represent ranges in net return-to-investment due to variations in discount rate (range: 5–20%) and contribution margin (range: 40–60%) secondary to conducted sensitivity analyses.

