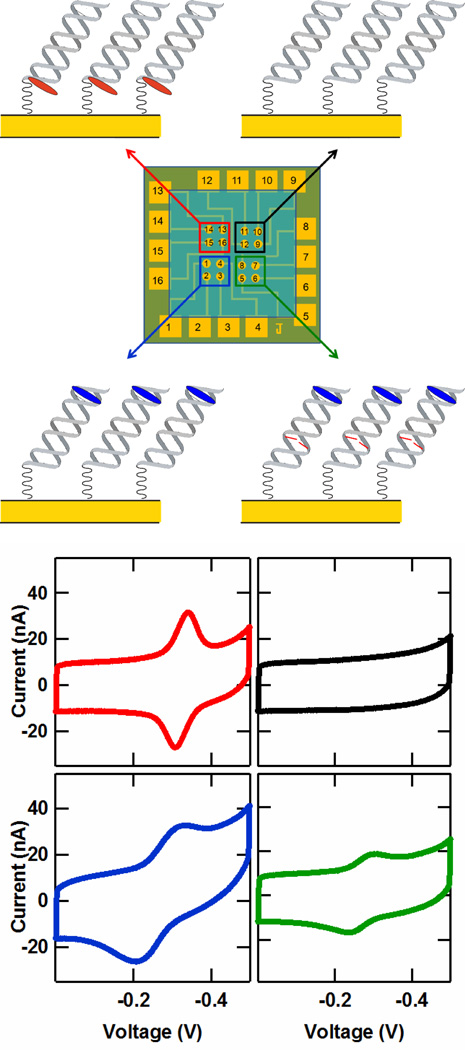
Figure 2.
Multiplexed detection on the DME chip. (Upper) Illustration of a DME chip layout with four distinct DNA target complementary strands. (Lower) Cyclic voltammetry data from each of the four DNA targets depicted in the upper figure. The four sequences consisted of (i) a well matched strand with a distal 5′ Nile Blue redox probe (5′-TNBGC GTC TCA GCT GAA GT-3, blue), (ii) a well matched strand with a proximal 3′ Redmond Red probe (5′-TGC GTC TCA GCT GAA GT(RR)-3′, red), (iii) a well matched strand with no redox probe (5′-TGC GTC TCA GCT GAA GT-3′, black), and (iv) a 5′ Nile Blue-labeled strand containing a single base-pair (CA) mismatch (5′-TNBGC GTC TCA GCT AAA GT-3, green). (TNB is a thymine modified with a Nile Blue redox probe, A notes the location of a single CA mismatch, and RR denotes a Redmond Red redox probe.) The potentials are reported versus Ag/AgCl with a CV scan rate of 100 mV/s, and each curve represents an average over the four electrodes in each chip quadrant.

