Figure 1.
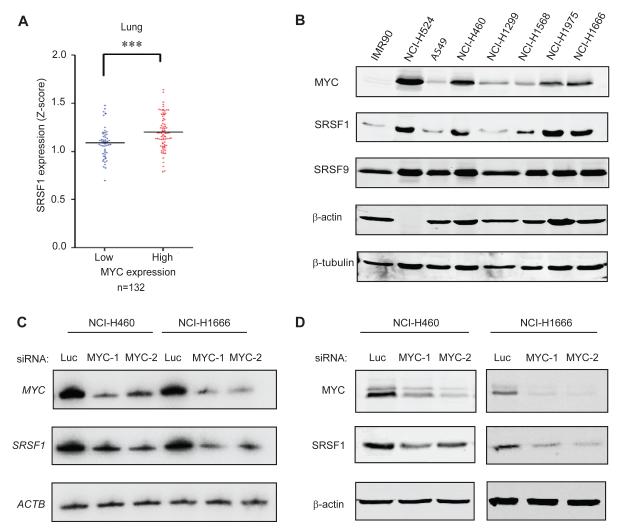
SRSF1 expression correlates with MYC levels in human lung tumors and cell lines. (A) SRSF1 expression profile from microarray analysis of 132 lung tumors (expO). The data were normalized to Z-score and divided into two categories: tumors expressing high or low MYC levels. The dot plot shows the distribution and the median (horizontal line). Mann-Whitney test ***P<0.0001. (B) Immunoblotting of MYC and SRSF1 in lung-cancer cell lines and lung primary fibroblasts, showing significant correlation between the expression of the two oncoproteins (r=0.75, one-tailed t-test *P=0.05). (C) RT-PCR and (D) Immunoblotting of MYC and SRSF1 in NCI.H460 and NCI.H1666 cells transfected with control siRNA (luciferase) or one of two siRNAs against MYC. See also Figure S1.

