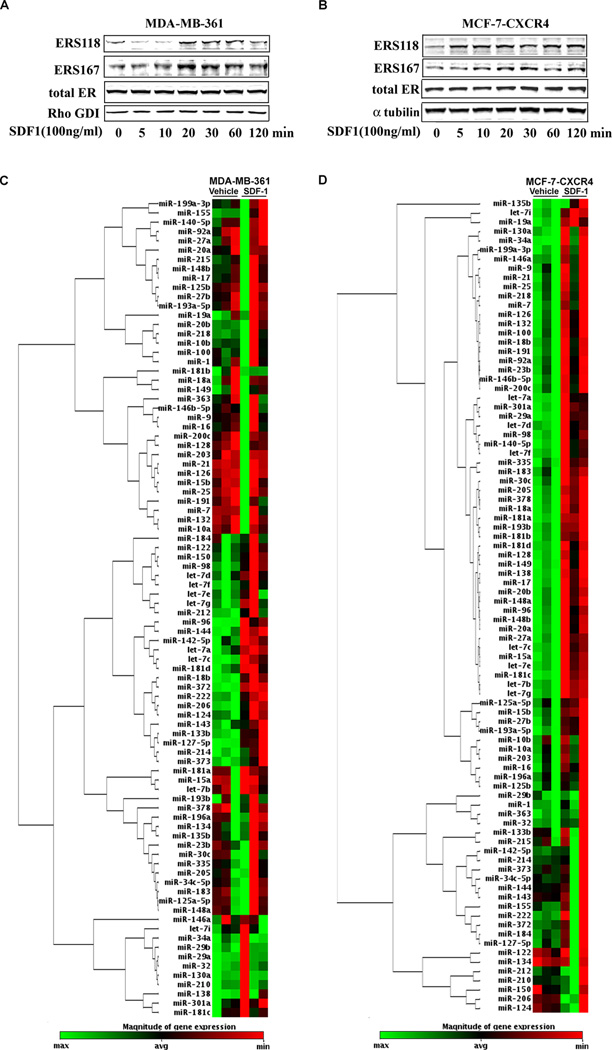
Figure 3. SDF-1 activates ER-α via phosphorylation and alters miR expression consistent with more advanced phenotype.
(A–B) Western blot analysis for ER-α phosphorylation at serine 118 and serine 167 in a time course treatment of (A) MDA-MB-361 or (B) MCF-7-CXCR4 cells with SDF-1 (100ng/ml) following 72 hours of serum starvation. Rho GDI or α-tubulin were used as loading controls. Each gel is representative of three independent blots. (C–D) Representative clustergrams of miRNA expression changes as determined by qPCR arrays in (C) MDA-MB-361 or (D) MCF-7-CXCR4 cells following 24 hours of treatment with SDF-1 (100 ng/ml). Red indicates increased expression, while green denotes decreased expression.

