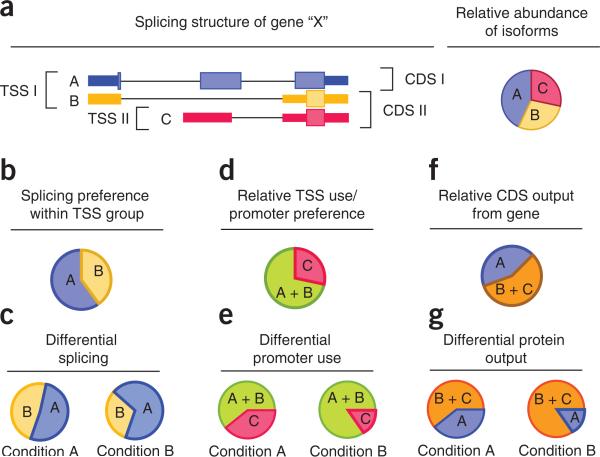
Figure 4.
Analyzing groups of transcripts identifies differentially regulated genes. (a) Genes may produce multiple splice variants (labeled A–C) at different abundances through alternative transcription start sites (TSS), alternative cleavage and polyadenylation of 3′ ends, or by alternative splicing of primary transcripts. (b) Grouping isoforms by TSS and looking for changes in relative abundance between and within these groups yield mechanistic clues into how genes are differentially regulated. (c) For example, in the above hypothetical gene, changes in the relative abundance between isoforms A and B within TSS I group across conditions may be attributable to differential splicing of the primary transcript from which they are both produced. (d) Adding their expression levels yields a proxy expression value for this primary transcript. (e) Changes in this level relative to the gene's other primary transcript (i.e., isoform C) indicate possible differential promoter preference across conditions. (f,g) Similarly, genes with multiple annotated coding sequences (CDS) (f) can be analyzed for differential output of protein-coding sequences (g).

