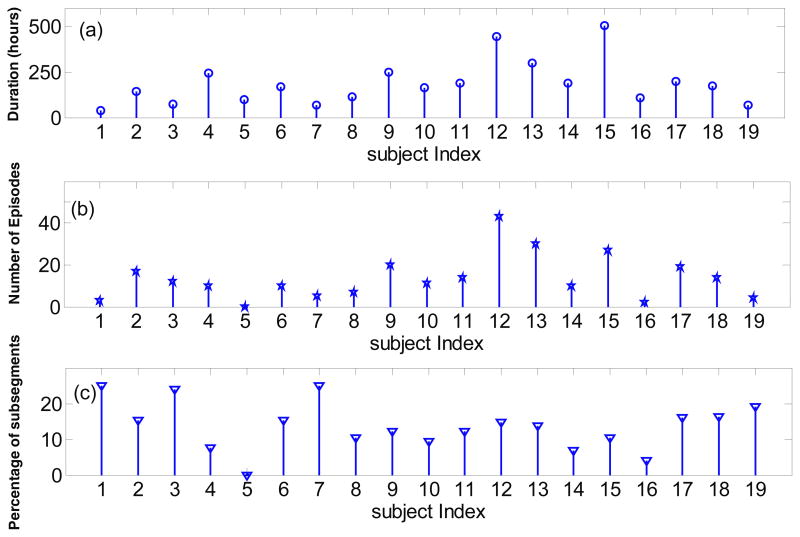
Figure 1.
Microdialysis data and episodes of Lactate/Pyruvate ratio (LPR) increase for all the subjects. (a) Time duration of microdialysis measurements in hours; (b) Number of the automatically identified LPR increase episodes; (c) Percentage of subsegments with length of 10 samples which are identified as an episode of LPR increase using the proposed method.

