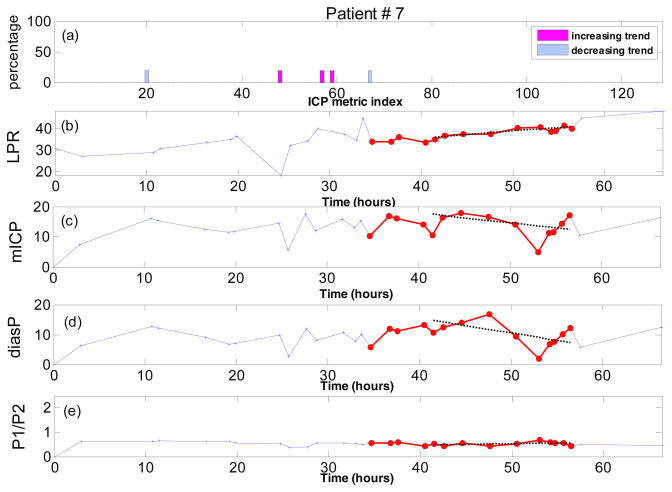
Figure 4.
Trend analysis for patient #7. (a) Percentage of LPR increase episodes with increasing or decreasing trend for all 128 ICP metrics; (b) The measured LPR over the time; (c) mean ICP (mmHg) over time; (d) diastolic pressure (mmHg) over time; (e) the ratio of the first peak to the second peak of the ICP pulse over time. All the sample points which belong to at least one automatically identified LPR increase episodes are highlighted with the red color. The dotted lines on (b), (c), (d) and (e) are the regression lines robustly fitted to the corresponding data during the last identified episode of LPR increase (length of 10 samples).

