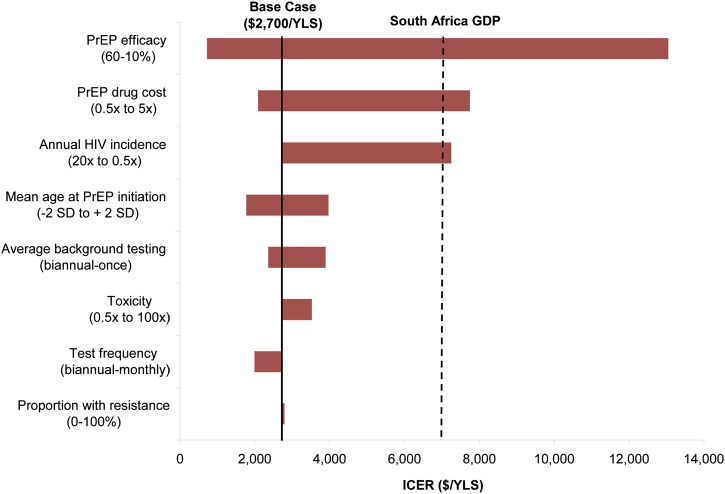
Figure 1.
One-way sensitivity analyses: incremental cost-effectiveness of pre-exposure prophylaxis (PrEP). This tornado diagram summarizes the results of multiple 1-way sensitivity analyses on the incremental cost-effectiveness of PrEP. Each horizontal bar represents the range of incremental cost-effectiveness ratios (ICERs) resulting from variations of a given model parameter across its plausible range, as indicated at opposite ends of each bar. The range for each bar is reported in the direction of the ICER for that bar. For example, higher human immunodeficiency virus (HIV) infection incidences and higher PrEP efficacies result in lower PrEP ICERs and are therefore reported from high to low as the bar moves from left to right. The bold vertical line indicates the base case ICER ($2700 per year of life saved). A bar reaching zero on the left would indicate cost saving (none of the bars reach that benchmark). The dashed vertical line represents the per capita gross domestic product (GDP) for South Africa, a threshold denoting a very cost-effective use of resources, by international standards [18–20].

