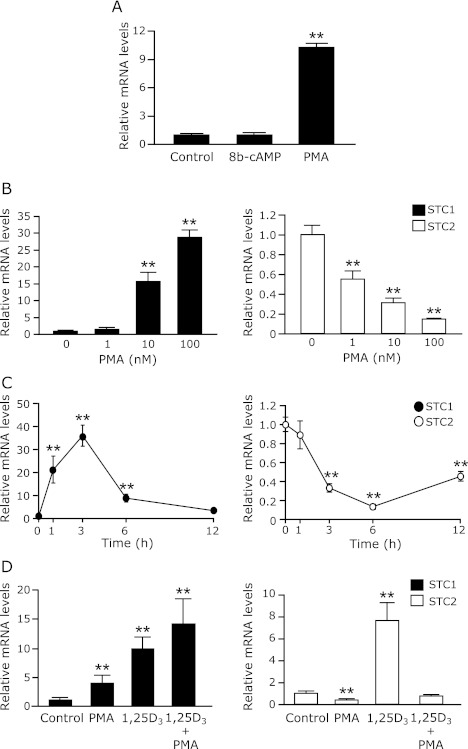
Fig. 4.
Effects of PMA on the STC1mRNA expression in OK-P cells. (A) OK-P cells were treated with the control or 100 nM 8-bro-cAMP, a specific PKA activator, or PMA, a specific PKC activator for 3 h. OK-P cells were also treated with (B) the different doses of PMA for 3 h, or (C) 100 nM PMA for time course study, or (D) 100 nM PMA for 3 h or 100 nM 1,25(OH)2D3 for 6 h. After treatment with 1,25(OH)2D3 and/or PMA, the cells were harvested and total RNA was extracted. The mRNA levels of STC1 and STC2 were determined by real-time PCR analysis. Results are expressed as the means ± SD (n = 3). *p<0.05, **p<0.01 compared with vehicle.

