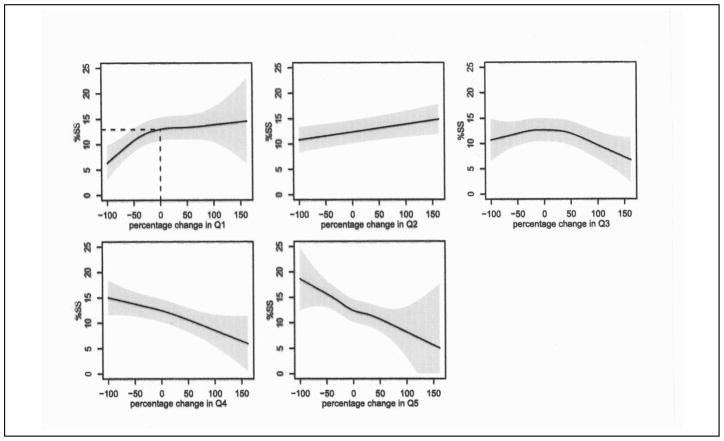
Figure 3.
Results of regression function which tested whether %SS is associated with percent change in PI counts, for each of five PI quintile ranges. Stuttering frequencies (%SS scores) are shown on the y axis; changes in PI frequency relative to the mean (with mean values shown as a 0% change) are shown of the x axis. Lines of best fit depict the results of the regression analysis; shaded regions depict 95% confidence intervals (see Methods). A horizontal line would suggest no relationship between the %SS scores and % changes in PI frequency counts.

