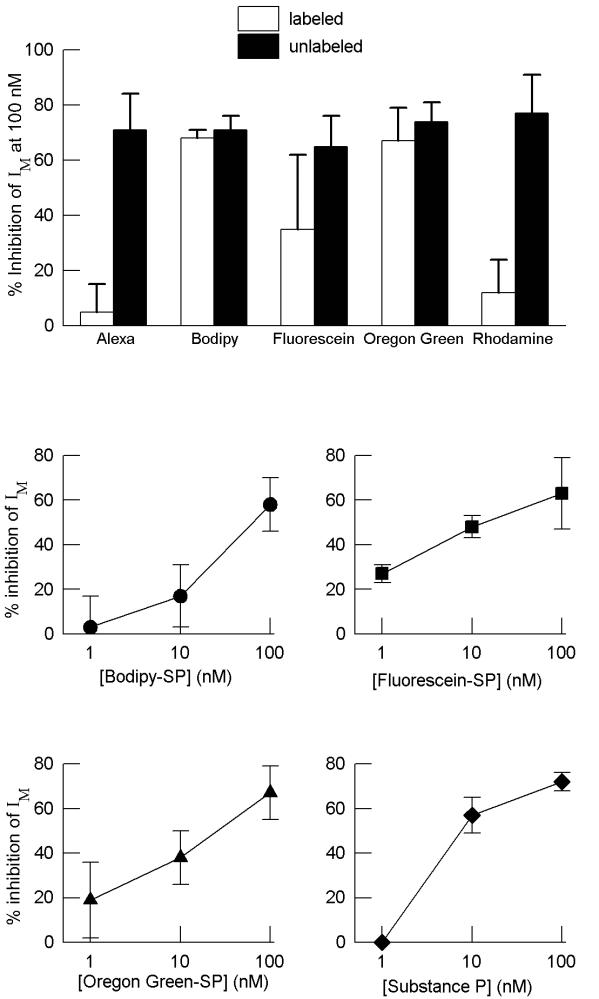
Figure 6.
Top panel - Comparison of the effects of conjugated and unconjugated SP on single neurons. The bars show the percent inhibition of IM produced by labeled or unlabeled SP at a concentration of 100 nM. Both drugs were applied to the same cell. Alexa 488-SP and tetramethylrhodamine-SP did not inhibit IM, fluorescein-SP only inhibited the current 50% of the time, where as BODIPY Fl-SP and Oregon Green 488- SP produced inhibitions similar to unlabeled SP. Bottom panel - IM inhibition dose response curve for labeled and unlabeled SP. Data is expressed as % IM inhibition. Each point represents an average of 4 experiments, except fluorescein-SP, which is only an average of 2 experiments. A dose-dependency was observed for each drug that inhibited the IM.

