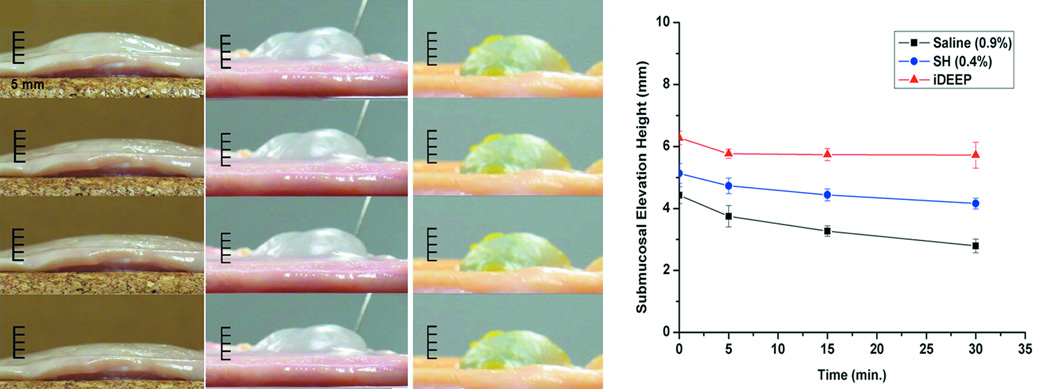
Figure 3.
Photographic images depicting the chronological changes in the submucosal elevation of A) saline (0.9%), B) sodium hyaluronate (0.4%), and C) iDEEP (30%) from top to bottom in turn 1, 5, 15, and 30 minutes after injection using porcine gastric samples ex vivo. D) Graphical representation of the chronological changes in the submucosal elevation.

