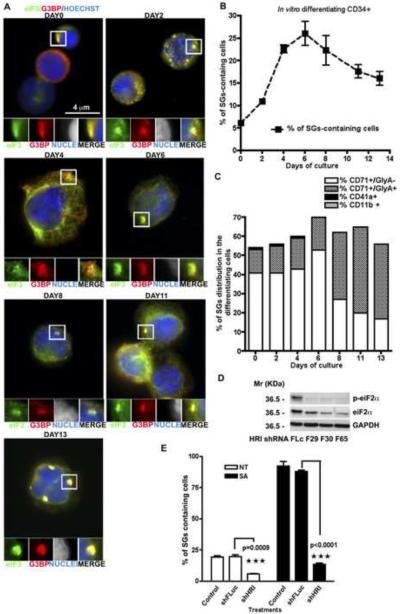
Figure 2. CD34+ erythroid precursor cells assemble HRI/p-eIF2α-induced SGs during in vitro maturation.
(A) CD34+ cells, collected at different days of in vitro differentiation were stained for SG markers eIF3b (eIF3, green) and G3BP (G3BP, red), in combination with Hoechst (blue) to reveal nuclei. Enlarged views (3.2 fold) of boxed areas depict separate channels and merged views of SGs. (B) The mean percentage (n=3) of differentiating CD34+ cells with SGs (quantified by counting >100 cells per sample per experiment). (C) Lineage and maturation specific assembly of SGs. CD34+ cells were stained for the indicated differentiation markers as well as markers specific for immature erythroid precursors (CD71), in combination with SG markers. At the indicated times, cells were processed for immunofluorescence microscopy and the percentage of SGs in cells from each lineage was quantified. n=3 ± SEM. (D) HRI knockdown reduces eIF2α phosphorylation. Representative western blots are shown, withGAPDH as loading control. (E) Percentage of spontaneous and arsenite-induced SGs in CD34+ hematopoietic cells. CD34+ cells were infected with the indicated lentiviruses four days prior to culture with or without SA. Cells treated with each shRNA were pooled together before cytospin and SG quantification. n=3 ± SEM

