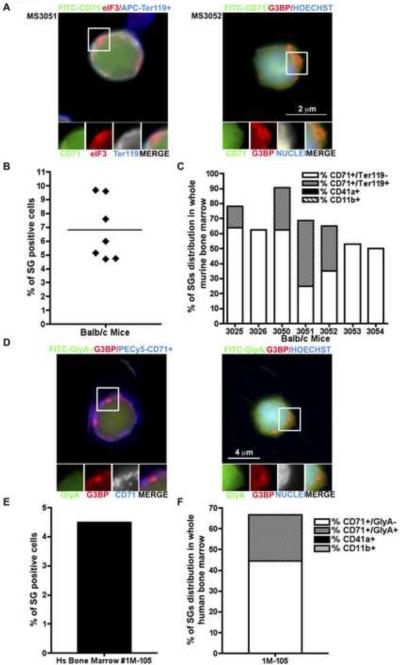
Figure 3. Mouse and human bone marrow erythroid precursor cells assemble SGs during in vivo maturation.
Total bone marrow cells Balb/c male mice were stained for markers of lineage differentiation (CD71-FITC, TER119-APC, CD41-FITC and CD11b-PECy5) and SGs (eIF3b and G3BP). (A) Left panel: A CD71+/Ter119+ erythroid cell (green/blue) containing eIF3b+ SGs (red) in bone marrow from sample MS3051. Right panel: A CD71+ erythroid cell (green) containing, G3BP+ SG (red) from sample MS3052. Enlarged views (1.7 fold) of boxed areas show separate channels and merged views of RNA granules. (B) The mean percentage of SGs containing cells was quantified by counting >100 cells from 3 independent fields per animal (seven mice). (C) Murine bone marrow cells were stained for the indicated differentiation markers, in combination with the SG markers eIF3 and G3BP. The percentage of SG positive cells from each lineage was quantified. Values are the means of 3 independent fields in which >100 cells were counted. (D–F) Total human fresh bone marrow collected from a healthy donor was stained for markers of lineage differentiation (CD71-PECy5, GlyA-FITC, CD41-FITC and CD11b-PECy5) and SGs (eIF3b and G3BP). (D) Left panel: A CD71+/GlyA- erythroid cell (blue) containing G3BP+ SGs (red). Right panel: A GlyA+ erythroid cell (green) containing, G3BP+ SG (red). (E) The mean percentage of SGs was quantified by counting >100 cells from 3 independent fields. (F) Total human bone marrow cells, stained for the indicated differentiation markers and the SG marker G3BP, showed that the majority of SG containing cells are erythroid cells. Values are the means of three independent fields in which at least 100 cells were counted. Enlarged views (1.6 fold) of boxed areas show separate channels and merged views of RNA granules.

