Fig. 1.
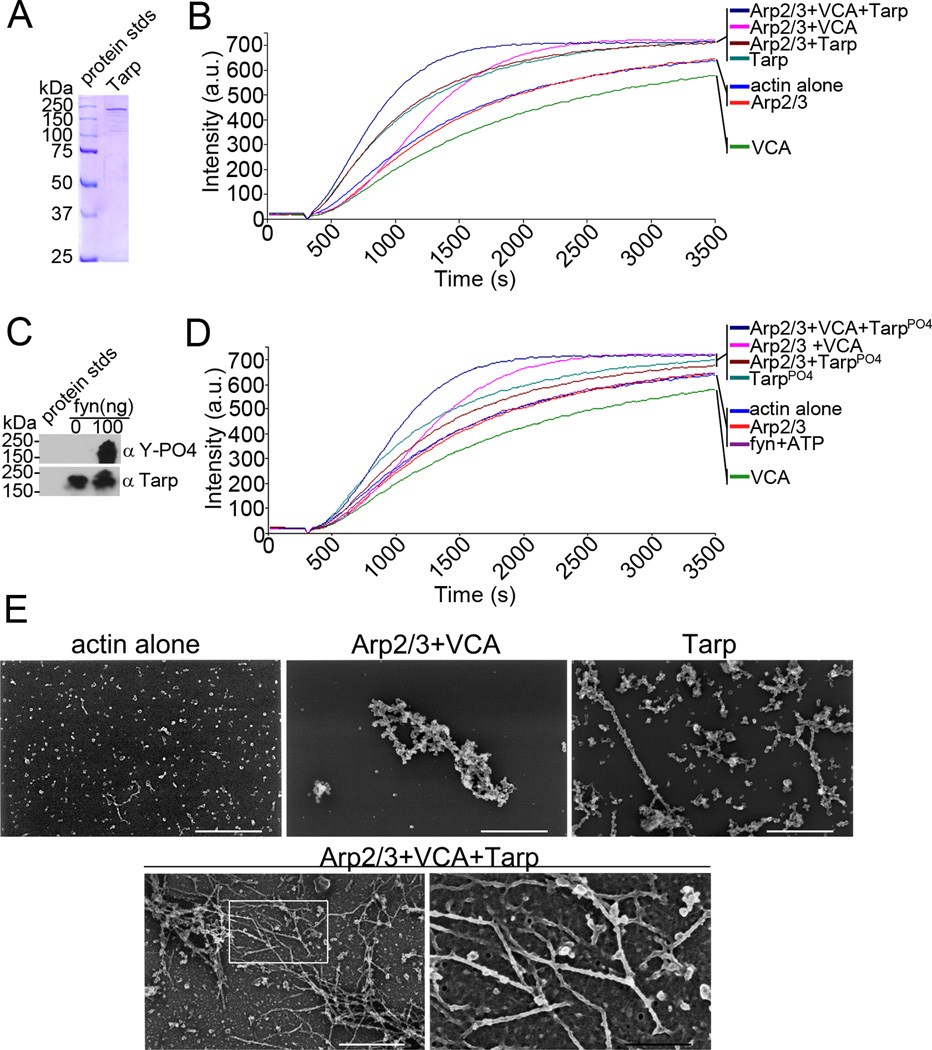
Tarp and Arp2/3 complex cooperate to polymerize actin. (A) Purified recombinant Tarp employed for these studies was resolved by SDS-PAGE and visualized by Coomassie blue staining. (B) Pyrene actin polymerization in the presence of Tarp and activated Arp2/3 complex (Arp2/3+VCA+Tarp) was compare to actin polymerization kinetics initiated by Tarp alone (Tarp), activated Arp2/3 complex alone (Arp2/3+VCA) and Tarp with an inactive Arp2/3 complex (Arp2/3+Tarp). Actin alone (actin), inactive Arp2/3 complex (Arp2/3) and the Verprolin, Cofilin, Acidic (VCA) domain of N-WASP served as additional controls. Bacterial and host cell nucleators were incubated with pyrene conjugated actin and actin polymerization was measured by an increase in fluorescence of pyrenyl-actin incorporated into actin filaments (Intensity (a.u.)) over approximately 1 hour (Time (s)) following the addition of polymerization buffer at 300 seconds. (C) Purified recombinant Tarp was phosphorylated by the Src family kinase member fyn. Tarp proteins were incubated with 100ng of purified fyn kinase and ATP and following a short incubation were suspended in protein sample buffer and resolved by SDS-PAGE followed by transfer to nitrocellulose. Immunoblots were performed with Tarp (α Tarp) and phosphotyrosine (α Y-PO4) specific antisera. (D) Pyrene actin polymerization assays as B but with phosphorylated Tarp. Additional controls include actin polymerization assays performed in the presence of fyn kinase and phosphorylation buffer containing ATP (fyn+ATP)(E) Electron micrographs of actin filaments nucleated by Tarp and the Arp2/3 complex. Protein samples were removed from actin polymerization experiments similar to those shown in B at 900 seconds (10 minutes after the addition of polymerization buffer) and actin filaments were visualized by scanning electron microscopy. White scale bar represents 400 nm and black scale bar represents 150 nm.

