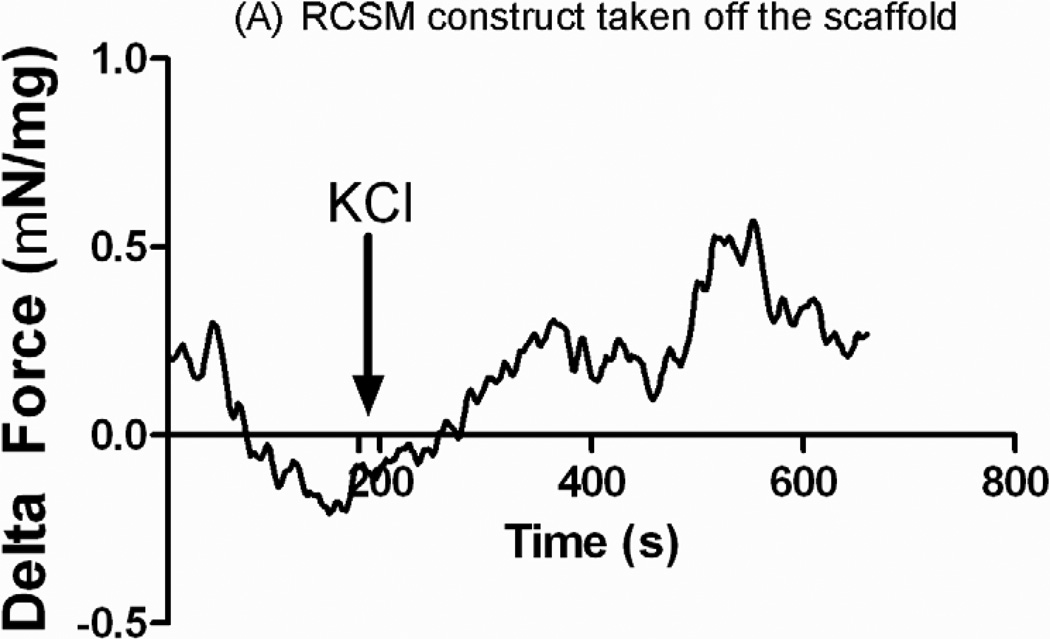
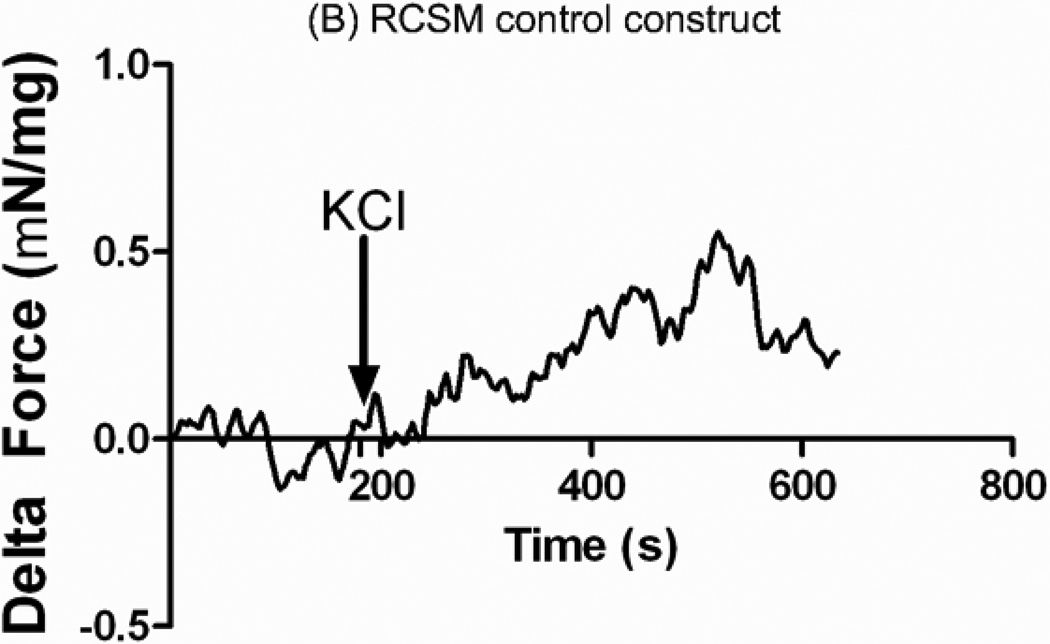
Figure 7.
Real time force generation was measured on the constructs taken off the scaffold at day 14 and on the control constructs using a force transducer. The graphs show the average force generated up on treatment with 60 mM potassium chloride (KCl) of an average of 0.48 ± 0.10 mN/mg of protein (n = 3) in the constructs that were around the scaffold (A) and 0.48 ± 0.05 mN/mg of protein (n = 4) in the control constructs (B). Addition of KCl is marked by the arrow at 180 seconds. Representative tracings for 3D bioengineered scaffold and control constructs have been chosen.


