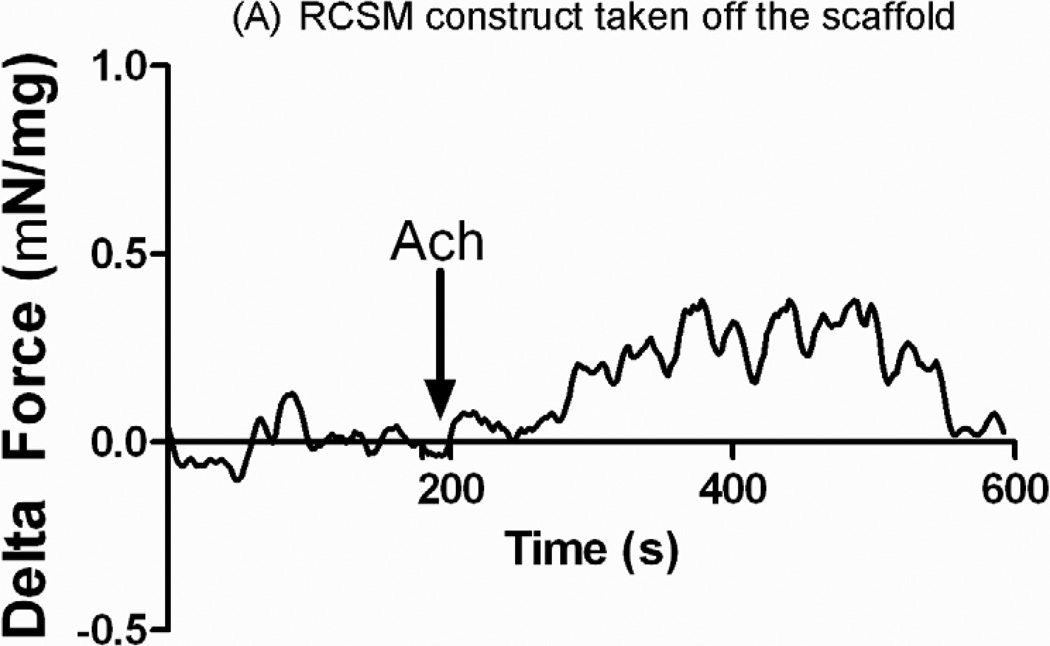
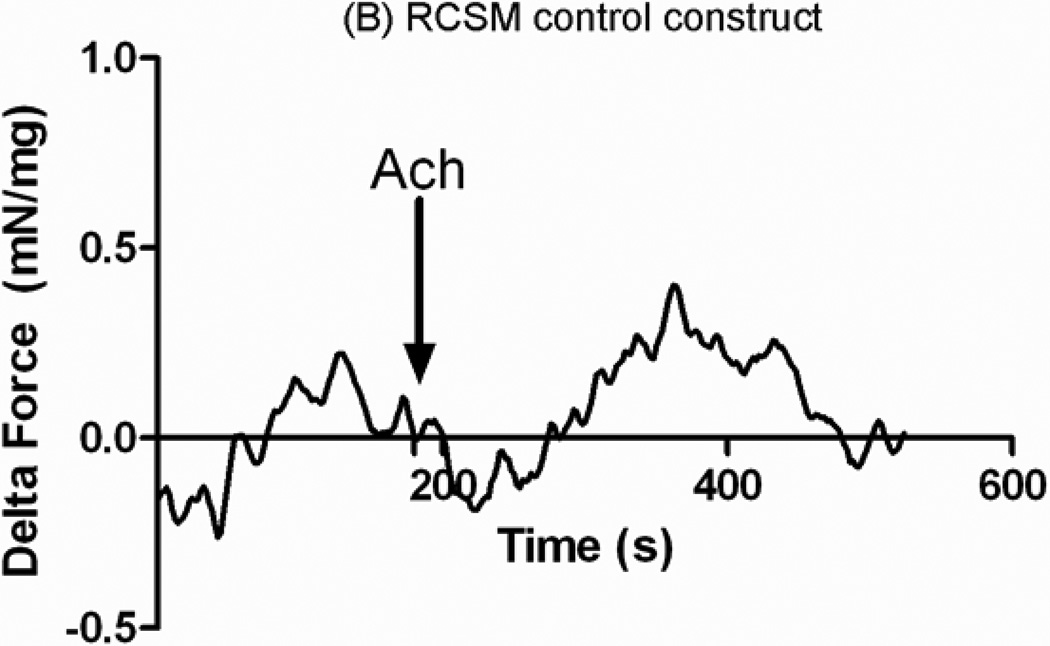
Figure 8.
Response in μN/μg of protein of the constructs that were around the scaffold (A) and control constructs (B) to Acetylcholine (Ach). Addition of 1μM of Ach is marked by the arrow. The constructs taken off the scaffold generated an average contraction of 0.55 ± 0.08 mN/mg of protein (n = 4) and the control constructs showed an average contraction of 0.5 ± 0.17 mN/mg of protein (n = 4). This graph is a representative figure.


