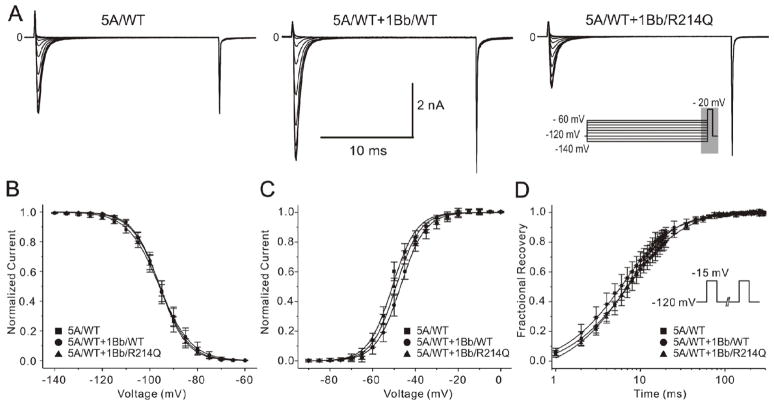
Figure 5. Functional characterization of SCN1Bb/R214Q on INa.
A: Representative traces recorded from wild-type (WT) and mutant channels in response to the voltage clamp protocol depicted on right middle inset designed to assess steady-state inactivation. B and C: Voltage dependence of inactivation and activation of SCN5A/WT and co-transfection of either SCN1Bb/WT or SCN1Bb/R214Q. Averaged values and the number of cells used are represented in Online Table 3. D: Recovery from fast inactivation of 3 groups determined using the two-pulse protocol shown in the inset. Fitting to a double-exponential function yielded the time constants demonstrated in Online Table 3. τf and τs in SCN5A/WT + SCN1Bb/R214Q were significantly slower as compared with SCN5A/WT + SCN1Bb/WT.

