
Figure 2.
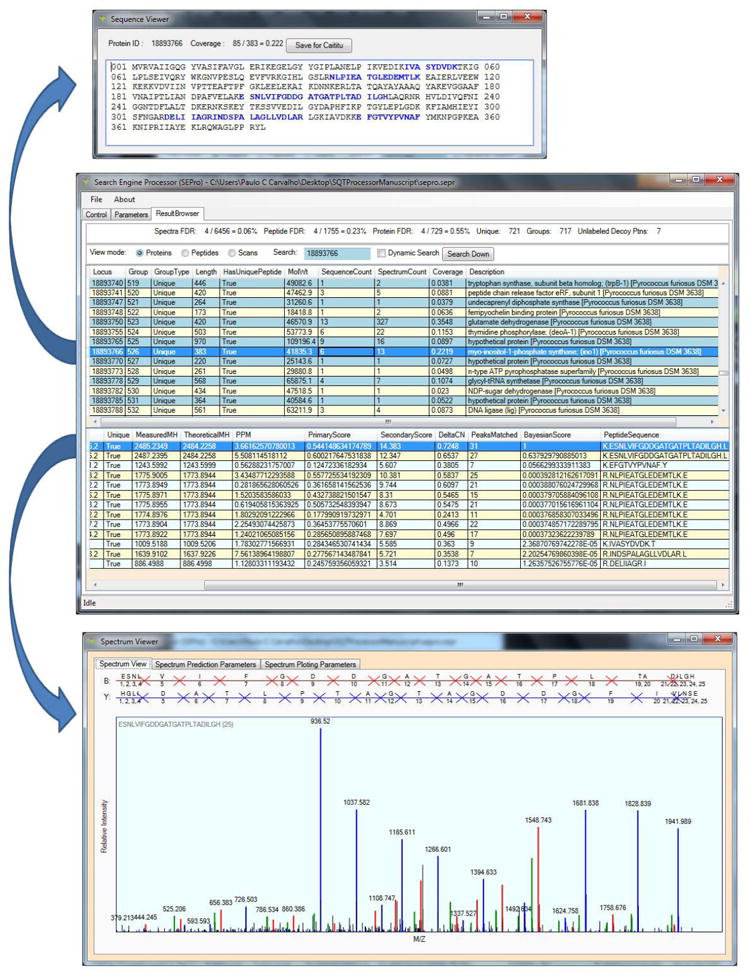
SEPro’s Results Browser. The Results Browser (middle panel) provides the flexibility and tools to maximize the experience in exploring and sharing the results. For example, by double-clicking on a protein identification one can view its FASTA sequence and the identified peptides highlighted in blue (top panel). By double-clicking on a PSM the annotated spectra will pop up (bottom panel); blue, red, and green peaks indicate y, b, and neutral loss ions, respectively.