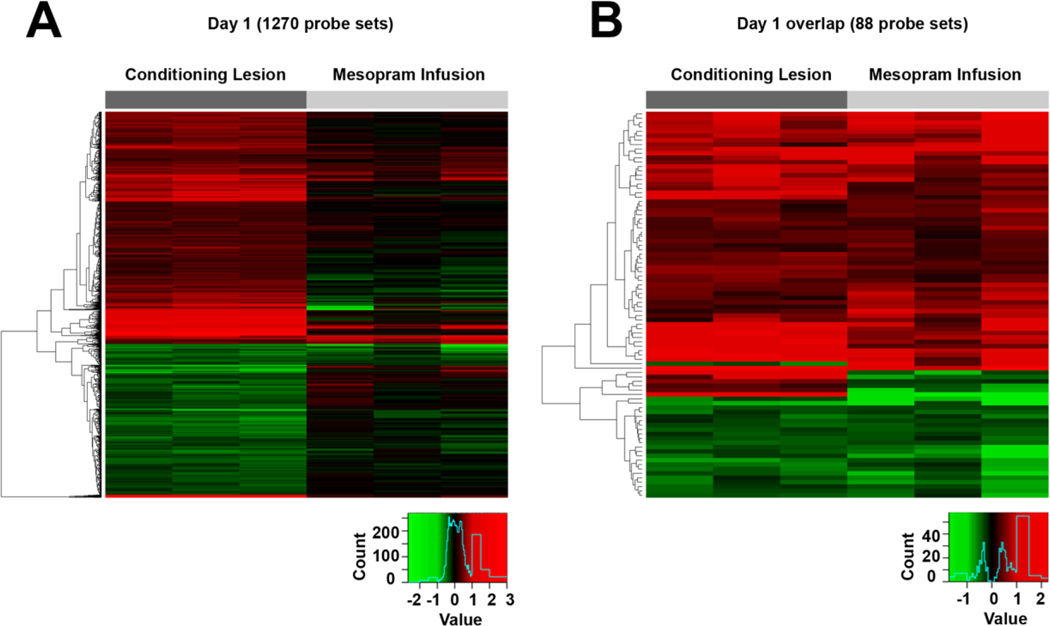
Figure 5. Heat maps depicting fold changes in gene expression one day following conditioning lesions and infusions of the phosphodiesterase inhibitor mesopram.
(A) A total of 898 probe sets are differentially expressed in DRGs after conditioning lesions (pFDR<0.05; change of > 20%) with limited overlap to the genes differentially expressed after mesopram infusion. (B) Gene expression is altered in the same direction for nearly all significantly changed probe sets overlapping between both groups. All comparisons are to DRGs of naïve control animals (see also Supplementary Data). Each column represents data from one array.

