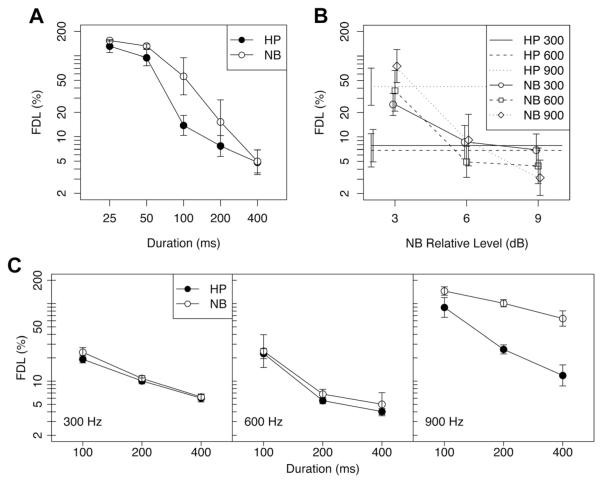
FIG. 1.
(A) The geometric mean results of phase 2 of the pilot experiment, showing the variation of the FDL with stimulus duration at 300 Hz. Error bars show standard errors across listeners. (B) The geometric mean results of phase 1 of the main experiment. FDLs for the 400-ms NB stimuli are plotted against the relative level of the NB. The symbols have been displaced slightly for clarity. The horizontal lines show FDLs for the HP stimuli. (C) The geometric mean results of phase 2 of the main experiment. Error bars show normalized standard errors, calculated after dividing the individual log FDLs by the geometric mean values for each set of three durations for each listener. This removes the variance due to overall listener performance.

