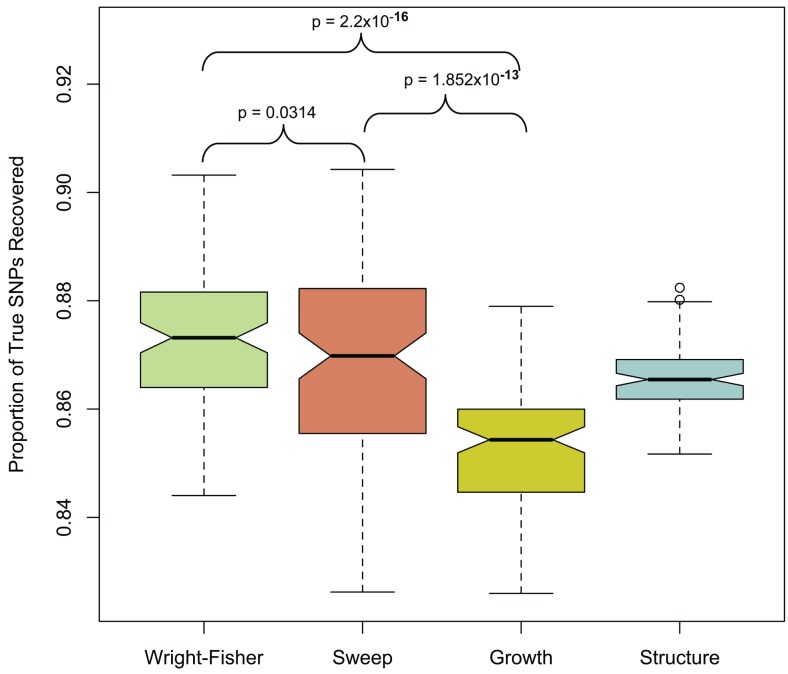
Figure 1.
Proportion of true SNPs recovered with 4× sequencing. Data from 100 simulations is presented for each population model (only the selection model with τ = 0.005 and α = 1000 and structure model with FST ≈ 0.37 is presented in each case, see Materials and Methods). Models were compared with paired t-test at a significance threshold of 5%. Note that the y-axis scale is limited from 0.84 to 0.92. The population structure model was not included in this particular statistical contrast (see Materials and Methods).

