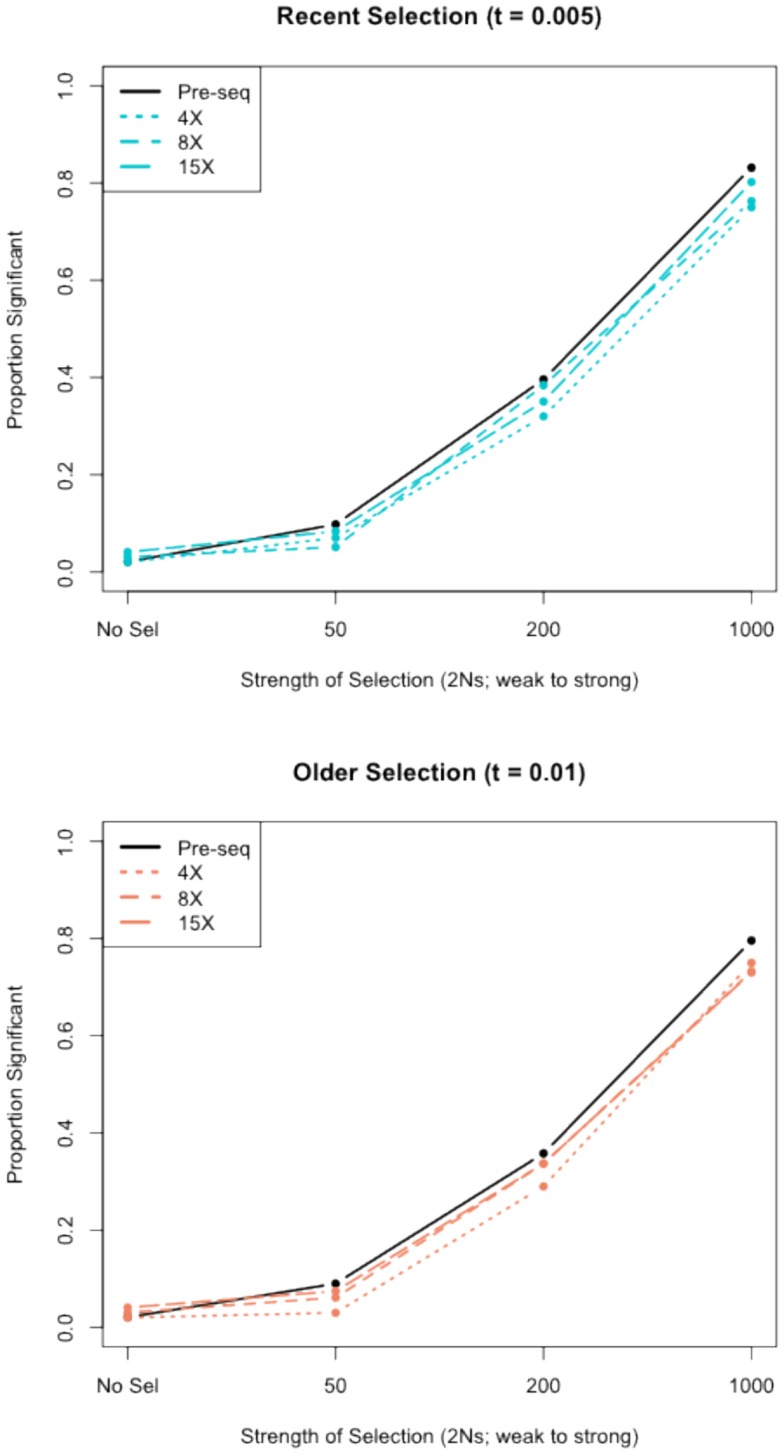
Figure A3.
The power to detect selective sweeps before and after simulated next-generation sequencing. The proportion of statistically significant detections of positive selection was calculated from simulations of a 30-kb region of 30 chromosomes with one selective sweep. Simulations were compared to a null distribution generated by neutral simulations and considered significant at 0.05 cutoff. The top panel shows the results for recent selective sweep models (τ = 0.005) and the bottom panel shows results for models with relatively older selective sweeps (τ = 0.01). “Pre-seq” refers to the complete sequence information, without simulated next-generation sequencing and SNP calling.

