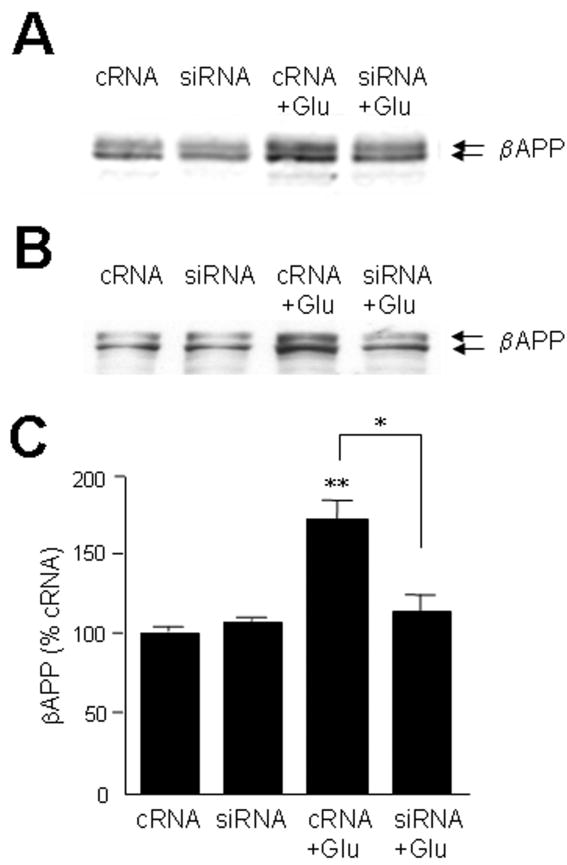
Figure 7.
Glutamate→ApoE→βAPP axis manifest in neuronal cultures. Cultures of primary rat cortical neurons (A) or NTera2 cells (B) were treated for 48 hours with 30 nM cRNA or siRNA directed against ApoE. Glutamate (20 μM) was then applied for 20 hours, after which βAPP levels were assayed by Western blot analysis. (C) Results from 3 experiments with NTera2 cells were quantified; *p < 0.05, siRNA+Glu vs. cRNA+Glu, **p < 0.01 cRNA+Glu vs. cRNA alone.

