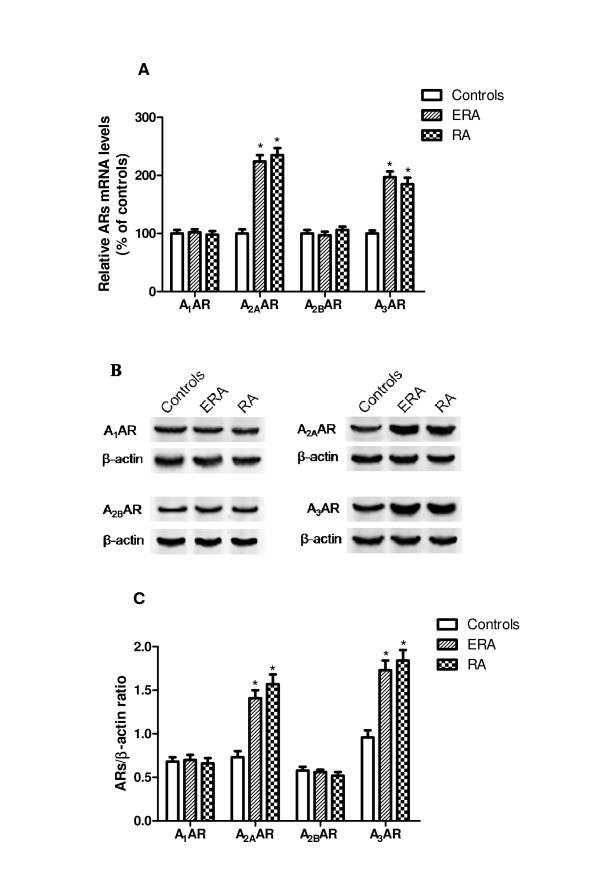
Figure 1.
A1 A2A A2B and A3ARs in RA patients. A) Relative AR mRNA levels determined by RT-PCR in human lymphocytes from ERA (n = 32), RA patients (n = 63) and control subjects (n = 90). B) Representative Western blotting analysis shows immunoblot signals of ARs in ERA, RA patients and controls. C) Densitometric analysis of AR expression in human lymphocytes from ERA (n = 32), RA patients (n = 63) and control subjects (n = 90) indicated as a ratio of β-actin (loading control). Data are expressed as a means ± SEM. *, P < 0.01 vs control group.

