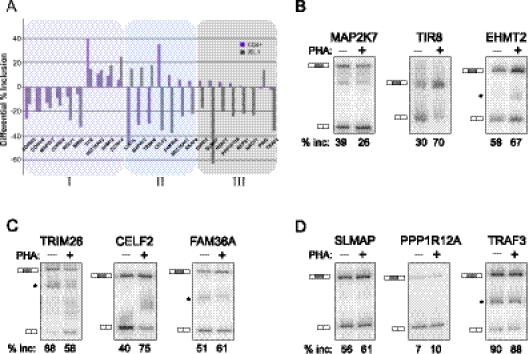
FIGURE 3.
Analysis of activation-induced splicing in CD4+ primary cells relative to JSL1 cells. (A) Graphical representation of the change in percent exon inclusion between resting and PHA-stimulated CD4+ cells (purple bars) compared with the change observed between resting and PMA-stimulated JSL1 cells (gray bars). The percent exon inclusion differential was calculated by RT-PCR and averaged from at least three independent donors (CD4+) and/or experiments (JSL1). Exons were further grouped in one of three categories: (I) responding similarly in both cell types (purple tint), (II) responding in an opposing manner in the two cell types (blue tint), or (III) showing no statistically significant change upon PHA treatment of CD4+ cells. See also Tables 1 and 2 for details. (B–D) Representative RT-PCR of isoform expression in resting (−PHA) versus stimulated (+PHA) CD4+ primary T cells, for genes in categories I (B), II (C), or III (D). The percent inclusion of variable exon shown is an average of at least three independent experiments.

