FIGURE 4.
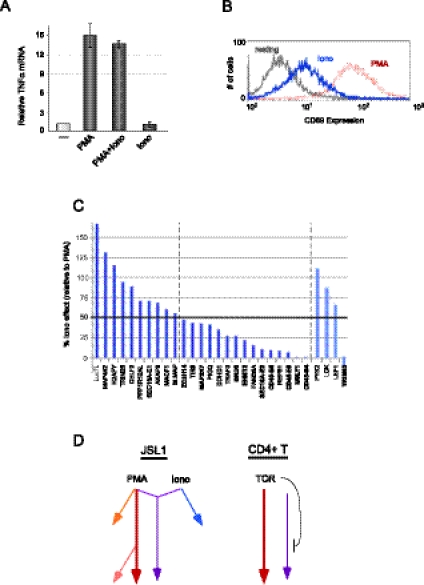
Analysis of signaling pathways in JSL1 cells and their effect on alternative splicing. (A) Induction of TNF-α expression in response to PMA and/or ionomycin treatment of JSL1 cells. TNF-α mRNA was measured by RT-PCR, and the average of two experiments is shown. (B) Cell-surface expression of CD69, as measured by flow cytometry, in JSL1 cells grown under resting (gray), PMA stimulated (red), or ionomycin-stimulated (blue) conditions. (C) Analysis of ionomycin-induced alternative splicing of the top 25 PMA-responsive genes. Ionomycin responsiveness was quantified by RT-PCR from at least three independent experiments, and the difference in exon inclusion between resting and Ionomycin-stimulated cells was graphed as a percent of splicing change observed upon PMA stimulation (PMA differential set to 100%). (D) Model of signaling pathways in JSL1 versus CD4 cells as indicated by alternative splicing responsiveness.

