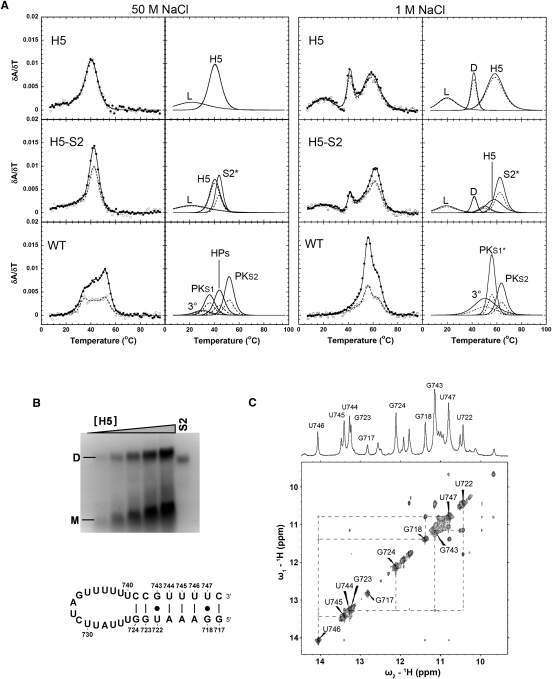
FIGURE 4.
Comparison of the melting profiles for the H5, H5+S2, and WT RNAs. (A) Profiles on the left show every fifth data point obtained at 260 nm (●) and 280 nm (○), and the calculated fits to the 260-nm (solid lines) and 280-nm data (dashed lines), with the individual transitions at 260 nm (solid lines) and 280 nm (dashed lines), which combine to generate the total calculated curves, shown separately to the right. The individual transition fits are labeled according to the correlated structural elements: (L) loop structure, (H5) helix V, (D) dimer, (S2*) stem 2 including 6-bp helix, (3°) tertiary structure, (HPs) the overlapped H5 and S2* transitions, (PKS1) pseudoknot stem 1, (PKS1*) pseudoknot stem 1 and 6-bp helix, (PKS2) pseudoknot stem 2, respectively. (B) Native polyacrylamide gel and H5 hairpin schematic. Monomer (M) and dimer (D) species are indicated to the left of the gel, and the S2 RNA was loaded as a size marker (61 nt) for comparison to the H5 dimer (64 nt). The H5 RNA sample concentrations were 0.5, 1.0, 1.75, 2.5, and 3.5 μM, respectively. The hairpin stem imino protons assigned in the NMR spectrum are numbered on the hairpin schematic. (C) 500-MHz 1D and 2D NOESY imino proton spectra of the H5 RNA at 10°C.

